
Energy arrives from the sun in the full gamut of wave lengths documented above. It is emitted by the Earth in a relatively narrow range in the infra-red between 1-125 um.
Ozone is made possible by the splitting of the oxygen atom by short wave radiation in the ultraviolet spectrum at wave lengths shorter than 250 nanometres, equivalent to 0.250 um. Once formed ozone can be broken down by wave lengths between 0.3 and 0.4 um in the ultraviolet.
Ozone is a greenhouse gas absorbing some of the very considerable sum of energy emitted by the Earth in the infra-red spectrum instantaneously transmitting that energy to adjacent molecules. But does this absorption in the infra-red contribute to the warmth of the stratosphere? You can survey the literature and find nary a reference to this phenomenon. The literature is dominated by the environmental concerns as to whether ozone is a significant pollutant in the troposphere and secondly, the degree to which its presence in the stratosphere enables the screening out of short wave energy that is harmful to plants and animals. The ‘ozone hole scare’ gave rise to the Montreal Protocol for the elimination of the use of certain gases including the commonly used ‘Freon’. Apart from that, the stratosphere is seen as largely irrelevant to the concerns of man, a place where the atmosphere is relatively static because ‘stratified’ with warmer air above colder air.
Now lets get to grips with the question posed in the heading:
WHY IS THE STRATOSPHERE WARM?
On a website prepared by the US Earth Sciences National Teachers association with the support of NASA we have this statement:
Temperatures rise with increasing altitude in the stratosphere. Ozone molecules in the stratosphere absorb ultraviolet radiation coming from the Sun. The energy from the UV radiation is transformed into heat. The heating is most intense near the top of the stratosphere, so that is where the stratosphere is warmest.
From Wikipedia we have:
Within this layer, temperature increases as altitude increases (see temperature inversion); the top of the stratosphere has a temperature of about 270 K (−3°C or 26.6°F), just slightly below the freezing point of water.[3] The stratosphere is layered in temperature because ozone (O3) here absorbs high energy ultraviolet (UVB and UVC) radiation from the Sun and is broken down into the allotropes of atomic oxygen (O1) and common molecular oxygen (O2). The mid stratosphere has less UV light passing through it; O and O2 are able to combine, and this is where the majority of natural ozone is produced. It is when these two forms of oxygen recombine to form ozone that they release the heat found in the stratosphere. The lower stratosphere receives very low amounts of UVC; thus atomic oxygen is not found here and ozone is not formed (with heat as the by product).
So, the question arises: Is the energy absorbed at short wave lengths that is involved in both the creation and destruction of ozone sufficient to explain the warmth of the stratosphere?
- Well, for a start we can note that the stratosphere is warmest at 1 hPa and not at 30 hPa (the mid stratosphere) where the Wikipedia article suggests that the heat is released in the creation of the ozone molecule.
- Secondly, we can note that the reversal of the lapse rate ( rate of temperature change with elevation) at the tropopause requires heating at and below that elevation to produce the reversal of the lapse rate. There is no way that short wave radiation is responsible for heating the atmosphere at and below the level of the tropopause.
Its obvious therefore that the notion that the heat of the stratosphere is due to interception of short wave radiation or produced as a by product of the formation of ozone is not a very satisfying proposition.
The profile of Earth emitted outgoing long wave radiation as measured by satellites reveals a deficit at 9-10 um due to absorption of part of that energy by the atmosphere. That is outgoing infrared energy lost to ozone. The deficit in outgoing radiation at 9-10 um represents a hole in the energy emitted that is close to the peak of the spectrum carrying the bulk of the energy emitted by the Earth. The energy at these wave lengths is abundant. That energy is absorbed by ozone in the troposphere (the troposphere contains about 10% of total ozone) and the stratosphere. There is absolutely no shortage of energy in the outgoing infra-red wavelengths to warm the stratosphere whereas the energy available in the incoming ultraviolet spectrum is but a tiny portion of that of solar origin.
The effort to map the distribution of ozone in the atmosphere by satellites can utilise the attenuation of radiation in the ultraviolet spectrum OR the infra-red spectrum to infer the presence and concentration of ozone. The Toms satellite utilised the former while more recently the availability of Japanese developed instruments abroad the Gomes satellite enables the measurement of ozone utilising the attenuation of the infra-red spectrum.
The source of this information is the following expert review:

Accessed here
The attenuation by ozone, water vapour and CO2 is graphed: 
We see that the attenuation of the energy available in certain wave numbers between 975 and 1100 rises to as much as 50% of the total with considerable energy lost to the atmosphere measured in terms of watts per square centimetre.
DENSITY CONSIDERATIONS
There is another consideration that is very important. It is conveyed in the following statement that can be accessed in the original at http://www-ramanathan.ucsd.edu/files/pr24.pdf

This is a very important dynamic that influences how and where the stratosphere absorbs outgoing infra-red. Consider this:
- The amount of radiation absorbed by ozone is pressure dependent.The lower that ozone is present in the atmospheric column the greater its heating capacity.This is of particular interest given the fact that ozone is ubiquitous throughout the atmospheric column in high latitudes and richly so in winter. The closer the poles are approached, the greater is its heating power, helping to explain the velocity of the jet stream that develops at the conjunction of dense ozone deficient air of mesospheric origin and warmer air that is ozone rich on the equatorial side of the polar vortex.
- The greater opacity of ozone in the troposphere, to the point that the troposphere absorbs as much energy as the entire stratosphere goes a long way to explaining the attenuation of the lapse rate at very low altitudes as we approach the poles. See here for lapse rates.
- This phenomenon helps to explain the origin of the energy behind the generation of so called ‘cold core’ cyclones that are in reality cold core only below 500 hPa , the origin of the uplift being an extensive warm core of low density air in the atmosphere manifesting strongly above 500 hPa.
In fact the bulk of short wave ionising UVC radiation with wave lengths shorter than 240 nm is absorbed by nitrogen and oxygen above 1 hPa while only a relatively small portion remains to directly energise oxygen and ozone in the stratosphere. It is reported that wave lengths shorter than 280 nm are required to ionize oxygen. The following table from here details the particular spectra absorbed at various elevations.

According to this table, it is the Herzberg continium between 200 and 242 nm (0.200 um to 0.242 um) that impacts oxygen in the stratosphere. whereas longer wave lengths up to 0.850 um impact ozone.
Accounts are conflicting. Fortunately, observation can settle the matter informing us as to the source of the warmth in the stratosphere.
OBSERVATION

Source: http://www.esrl.noaa.gov/psd/map/time_plot/ (latest version).
At left we have a hovmoller diagram showing us the evolution of surface temperature from 2005 through till 2011 at 20-40° south latitude. On the right there is another hovmoller showing the evolution of temperature at 10hPa over the same time interval. At 10 hPa the partial pressure of ozone in the air in relation to the other gases peaks. It peaks there in part because it is gathered together in the lower atmosphere in low pressure cells of its own creation and lifted to the top of the atmospheric column. Only 1% of the atmosphere lies above the 10 hPa pressure level. The maths is (10/1000)*100/1 = 1%
10 hPa represents an elevation of 30 km. For surface dwellers that’s just a five hour walk. Fifteen minutes on the free-way. In terms of radiation from the Earth the transit from surface to 10 hPa takes no time at all.
There is plainly a variation in the temperature at 10 hPa associated with the season of the year. There is also an obvious warming above the land masses that radiate strongly in summer. Plainly, the temperature of the stratosphere at 10 hPa responds strongly to variations in emissions of long wave radiation from the Earth.
It apparent that the temperature of the stratosphere is in some part due to the emission of infra-red radiation from the Earth, an entirely different story to that pedalled by NASA, the teachers association and Wikipedia.
IMPLICATIONS
Wherever ozone travels, and regardless of its altitude, it becomes a potent means for local heating by day and the night, including the long polar night when ozone partial pressure increases due to the absence of photolysis. Ozone for its very existence depends primarily upon :
- the photolysis of oxygen,
- Diffusion and transport processes,
- Chemical depletion of ozone by NOX, water and other agents,
- The pressure of photolysis of ozone that varies with latitude and season. In winter, low sun angles reduce the pressure of photolysis allowing the seasonal increase in ozone partial pressure. In the polar night there is zero photolysis of oxygen or ozone, neither creation nor destruction .
It is the rate of destruction by photolysis, chemical depletion and transport phenomena that are the critical factors determining ozone partial pressure in high latitudes. It is in the winter hemisphere that we see large variations in the temperature of the stratosphere, air density and consequently winds of extreme velocity. Surface pressures are driven to a planetary low on the margins of Antarctica where ozone partial pressure peaks. In high latitudes the only energy available to ozone in winter is long wave from the Earth itself. But this is more than adequate to drive polar cyclones and also, via a flux of pressure on all time scales, the distribution of atmospheric mass with its associated variations in weather and climate.
Moreover, cloud cover depends upon the flux in the area occupied by high pressure cells, and this determines the rate of accumulation of energy in the global oceans. What ascends to the limits of the atmospheric column gives rise to an equal and opposite descent. The diagram below that shows 200 hPa temperature varying much more widely than the temperature of the surface at 25°-35° south latitude amply reinforces this particular point. The temperature of the air at 200hPa responds to the presence of ozone. At this altitude violent winds redistribute atmospheric constituents in the horizontal domain

MORE OBSERVATION
There is another way to look at this question of the source of energy that heats the stratosphere and that is in terms of the diurnal range between day (abundant short wave radiation) and night (no short wave radiation from the sun at all).
Siedel et al in a paper that you can access here investigated the diurnal range of temperature at different elevations from the surface through to 10 hPa. The diurnal range at 10 hpa was found to be about half the range of that at the surface and one fifth of the range of actual skin temperature. Plainly, the small diurnal response to the presence of sunlight points towards a large role for outgoing long wave radiation in determining the temperature of the stratosphere. Between day and night there is an ON/OFF relationship between the availability of short wave radiation from the sun. The emission of long wave radiation continues across the 24 hour interval. Siedel et al found a smaller diurnal range of temperature over the ocean than over the land and a larger range in the summer when the diurnal temperature variation at the surface is greater, than in the winter. The timing of the peak in the daily temperature becomes less defined and is more variable as altitude increases. This indicates that the circulation of ozone, as a source of local heating, is more important in determining atmospheric temperature than is the 24 hour rotation of the Earth on its axis and the resulting flux in the availability of short wave solar radiation. It confirms that the warmth of the stratosphere is primarily a direct response to the ability of ozone to intercept outgoing long wave radiation rather than direct heating in the process of photolysis or energy release via recombination phenomena.
IMPLICATIONS
Why worry about this you ask? The origin of the energy to heat the stratosphere is a matter of considerable importance because ozone heating in the winter hemisphere is the origin of the variation in surface weather and climate on all time scales. If one is not cognisant of the source of heating that gives rise to the stratosphere it is hard to conceive that the winter stratosphere can play a major role in the evolution of weather and climate. If one imagines that the temperature of the stratosphere is due to incoming short wave radiation alone then the source of the so called ‘coupling of the troposphere and the stratosphere’ becomes a baffling mystery. To be charitable, the misunderstanding of atmospheric processes amongst those who write UNIPCC reports has its roots in misconceptions, a failure to observe and disinterest based upon unshakeable belief patterns. Science thrives on scepticism, curiosity, observation and checking. Dogma is the companion of superstition and fear. Dogma is also the source of inappropriate responses to natural phenomena. It has led to the burning of witches. It has led to the demonization of carbon dioxide, a trace constituent in the atmosphere that represents plant food, a substance at the base of the food chain for which demand is so voracious that it has never been anything but a trace constituent of the atmosphere or the ocean. Today it stands at 400 parts per million in the atmosphere, the advance from 300 ppm leading already to a marked greening of semi arid climates. Give a plant more CO2 and it requires less water.
MORE OBSERVATION: OZONE HEATING AT 200 hPa IN WINTER
The supposed ‘greenhouse effect’ is theoretically due to a downward flow of energy from the atmosphere above to the atmosphere below via back radiation. It is conceived that it occurs in the troposphere where the air is cooler at elevation than it is below. The notion that cooler air can heat warmer air is anti-intuitive but let’s accept for the sake of the argument that it might be possible. How much more influential would back radiation be if the air above were warmer than the air below? Intuitively, that proposition makes more sense.
Uniquely, unlike other greenhouse gases the distribution of ozone is not homogeneous. A tiny fraction of the 10-15 ppm that manifests at 30 hPa is obviously very effective in heating the atmosphere in both the troposphere and the stratosphere. Manifestly it results in the cessation of cooling with increasing altitude and a marked reduction in the lapse rates at pressure levels well below the level of the tropical tropopause in mid and high latitudes.
By virtue of its uneven distribution ozone offers us an opportunity to test the notion that gases that absorb radiation from the Earth produce an increase in the temperature of the atmosphere beneath the level where this gas absorbs energy. In that respect give your best attention to the graph below:
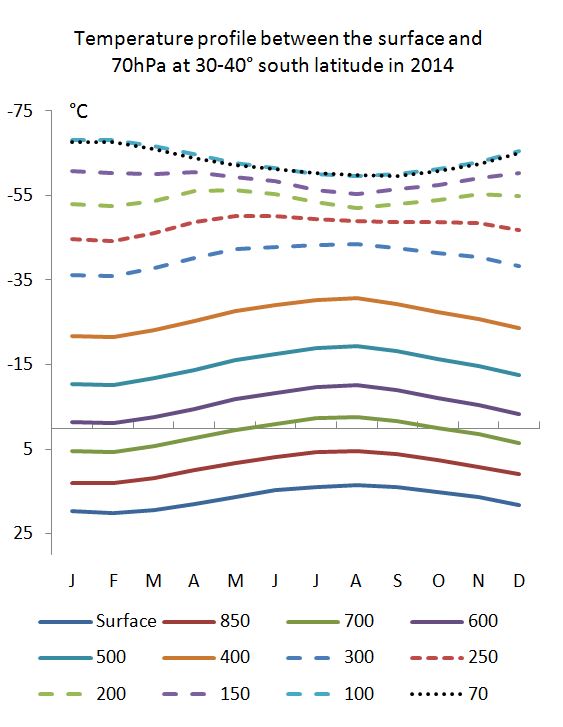
We see that at 30-40° south latitude the temperature of the air above the 200 hPa level is warmer in winter than in summer. Of course the surface is colder in winter. And the incidence of ultraviolet radiation is less in winter. Plainly, the temperature response is due to the enhanced presence of ozone in the winter atmosphere and its ability to gather energy from the Earth itself via absorption of infrared.
Somewhere between the ozone heated portion and the surface we should see the impact of a warmer upper atmosphere via the impact of back radiation. This is plainly not evident at 400 hPa and 500 hPa, let alone the surface. I know of no study that demonstrates that back radiation from the upper troposphere influences the temperature of the lower troposphere as the ozone bearing layers warm in winter. If the supposed ‘greenhouse effect’ were operational we would should see an effect on the lapse rate below 500 hPa. No such effect is observed. Theory is one thing. Demonstration is another thing entirely. If the predicted effect is absent the theory is of no use to man or beast. One instance of failure of prediction based on theory should be enough.
NOTION OF A ‘TROPOPAUSE’
Observe that the pressure level where temperature stops descending with increased elevation at 20-40° south (the diagram above) is 100 hPa. So, above 100 hPa, in fact at 70 hPa the temperature is no different to 100 hPa. Early observers of the stratosphere, unable to observe the temperature above these levels conceived that the stratosphere was ‘isothermal’, with little or no change in temperature with increasing elevation.
If we conceive that the elevation where air temperature no longer falls with elevation marks the start of the stratosphere then 100 hPa is the location of the ‘tropopause’ and the stratosphere is held to start at that point. In consequence we include a region that shows a strong temperature response to the presence of ozone in that part of the atmosphere that we call ‘troposphere’. The Jet stream manifests between 300 hPa and 100 hPa. It is a creature of the variable proportion of ozone in the air between about 300hPa and 70hPa. Meteorologists recognise that the atmosphere beneath the jet stream conforms to the pattern of spatial variation that manifests as waves in the jet stream. They speak of the jet stream ‘steering’ the pattern of high and low pressure cells that define surface weather conditions. By defining a portion of the ozonosphere as ‘troposphere’ climate theorists effectively rule out of contention any notion that ozone is important to surface climate. This is a case of throwing the baby out with the bath water. Silly boys.
It is the heating response to the presence of ozone between 300 hPa and 70 hPa that creates the density differences that give rise to the jet stream. Surface weather on all time scales is driven by the radiative response to ozone between these pressure intervals.
Our failure to understand the origins of surface weather and climate change is a product of this sort of conceptual confusion. Conceptual confusion arises when people are dogma bound.
CONCLUSION
Greenhouse theory and the concept of ‘radiative forcing’ that is at the core of IPCC reports is no better than armchair speculation uninformed by observation.
The countervailing influence to atmospheric radiation is convection. The heating of the polar troposphere/stratosphere due to enhanced ozone levels results in polar cyclones and result in the lowest surface pressures experienced at any latitude. Historically surface pressure has declined at all latitudes south of 50° south as the temperature of the stratosphere has increased. A warmer stratosphere indicates increasing levels of ozone, in contrast to the ozone hole narrative that gave rise to the Montreal Protocol. This loss of pressure in the high latitudes of the southern hemisphere shifts atmospheric mass to the remainder of the globe altering climates globally via change in cloud cover and the origin of surface air flows.
Can back radiation withstand the countervailing influence of convection in a rising column of air? It’s plainly just not possible.
The atmosphere is never static. Only if it were static could back radiation effectively warm the atmosphere beneath the point where the warming occurs. For greenhouse theorists I see a little problem in logic and some additional problems in understanding the role and efficiency of convection as an agent of energy transfer.
THE MARK OF CLIMATE CHANGE

The 30 hPa level is in the heart of the stratosphere. It is the at the heart of the so called ‘ozone layer’. The diagram above indicates a change in the most influential element in the climate system that governs the evolution of the planetary winds. Why is this basic parameter unrecognized, languishing in obscurity and unrepresented in climate models?
There is a problem in conceptualisation that relates to an inability to connect the dynamics of jet stream establishment and behaviour with the changing concentration of ozone across the year, between years and over time with the pattern of wind and temperature at the surface of the Earth. At the root of this problem is the inability to see that ozone is a potent source of warming of the atmosphere via the absorption of the abundant energy emitted by the Earth itself, that the extent of the warming directly depends upon atmospheric density and is therefore greater at lower elevations than higher, and that ozone manifests at 300 hPa at 20-40° south latitude and lower again as latitude increases. Furthermore, the ozone content of the air depends upon sun angle (rate of photolysis), photolysis rates falling away quite dramatically in winter. Furthermore, atmospheric pressure so far increases at the pole in winter that air from the mesosphere is drawn into the stratosphere inside what is referred to the polar vortex. It is the dynamics so created that are responsible change in the ozone content of the air and with it surface weather.
Gordon Dobson observed back in the 1920’s that total column ozone maps surface pressure. Climate theory, unable to comprehend the importance of that observation is obsessed with unrealities. In common parlance, its off with the fairies.
Practically speaking, the energy generated by the sun is acquired, stored in some mediums better than others but it doesn’t hang about in the atmosphere. The atmosphere is a cooling medium. If the Earth slowed in its rotation so that it experienced the warming radiation from the sun on a 48 hour rather than a 24 hour cycle, then the night side would get very cold regardless of the composition of the atmosphere. If the oceans, a great store of energy, were to evaporate then the night side would become very cold. If one were to double the thickness of the atmosphere and double its greenhouse gas concentration it would not stop the night side cooling. Let’s face it, greenhouse theory is almost universally supported but it exists only in a thought bubble. There is yet to be a demonstration that so called greenhouse gases of anthropogenic origin produce one iota of difference to surface temperature.
The concept of radiative forcing, the basis of UNIPPC climate science, is specious nonsense.
The temperature of the air at the surface is close to the temperature of the surface. If the air at the surface is moving, it is warmer or colder according to the place from which it comes. That is the way the world works.
TABLE OF CONTENTS
There is a body of work that is being presented here, as a blog. Very unusual. It follows a carefully planned logical sequence. You can access all the chapters in this ‘treatise’, in reverse, at: https://reality348.wordpress.com
1 HOW DO WE KNOW THINGS? The virtue of taking in the broadest possible view using our own senses rather than relying on the opinions of others.
2 ASSESSING CLIMATE CHANGE IN YOUR OWN HABITAT Employing reanalysis data and a spreadsheet to take the long view
3 HOW THE EARTH WARMS AND COOLS-NATURALLY. A top down mode of causation is described. This mode of change is capable of explaining variations in both the short and long term in both directions, both warming and cooling. It can explain warming in one place and simultaneous cooling in another. In short it is very well adapted to explain the climate changes that we observe from daily through to centennial time scales ……. and to do so, exclusively and completely.
HERESY AND ORTHODOXY. Some impromptu observations on the inexplicable entanglement of science and politics. On exercising control, suppression of ideas, the nature of propaganda and ‘results oriented behaviour’ that is antagonistic to the interests of humanity in general.
IN THANKS TO STEPHEN WILDE. Some off the cuff comments on the nature of the atmosphere and climate science directed to a man who struggles earnestly in that same field of endeavour.
IT’S SIMPLE SIMON. A brief, impromptu exploration of the nature of the atmosphere.
4 THE GEOGRAPHY OF THE STRATOSPHERE. A re-examination of the nature of the troposphere and the stratosphere via a study of the lapse rate of temperature with elevation as it varies with latitude. Lots of heresy here.
5 THE ENIGMA OF THE COLD CORE POLAR CYCLONE. A cyclone cannot come into existence in the absence of a warm low density core. In short the polar cyclone is cold below and warm above. Ozone kick starts and then accelerates the circulation of the air in a fashion that is more vigorous than is possible anywhere else on the globe. An investigation of the agent that is responsible for natural climate change on all time scales……arguably the only form of climate change that the surface temperature that is consistent with the surface temperature record.
6 THE POVERTY OF CLIMATOLOGY. There is a palpable disconnect between observation and theory. Surface temperature is linked to geopotential height increases that are common from the surface to the 200hPa level in turn linked to change in the ozone content of the air…….as yet unrealized in academic and meteorological circles. Does this represent simply a failure to think things through, or something more sinister? The signature of ozone variability is date stamped into the tropical sea surface temperature record.
7 TEMPERATURE EVOLVES DIFFERENTLY ACCORDING TO LATITUDE. A brief survey that establishes the diversity that exists in the nature of the way temperature changes at different latitudes. On the face it, completely inconsistent with greenhouse theory.
8 VIOLATILITY IN TEMPERATURE. In George Bernard Shaw’s play ‘Pygmalion’ that gave rise to the Lerner and Loewe musical ‘My Fair Lady’, Henry Higgins declares that he can tell where a person comes from according to the accent in their speech. Equally, it is possible to detect the origin of temperature change, natural or otherwise, via a close study of the evolution of temperature over time. This is a critical chapter. It identifies the signature of the mode of natural climate change that is written into the temperature record. It points to origin and causation. Unfortunately, nobody looks.
9 MANKIND IN A CLOUD OF CONFUSION Coming to grips with the true nature of the atmosphere rather than the fairyland version promoted by climate science.
THE ARCTIC STRATOSPHERE SO COLD TODAY. An impromptu investigation of the forces active in the Arctic stratosphere.
10 MANKIND ENCOUNTERS THE STRATOSPHERE The evolution of the planetary winds and temperature at the surface of the Earth is intimately associated with flux in surface pressure wrought by ozone heating in high latitudes.
11 POPULATION, SCARCITY AND THE ORGANIZATION OF SOCIETY. What is the most desirable temperature regime for humanity? What would we prefer?
12 VARIATION IN ENERGY INPUT DUE TO CLOUD COVER. An investigation of the relationship between cloud cover and surface temperature
13 THE PROCESSES BEHIND FLUX IN CLOUD COVER. Change in cloud cover is manifestly a major mode of natural climate variation. This is basic stuff. Here is where the investigation should begin.
14 ORGANIC CLIMATE CHANGE. Focus on natural processes that account for surface temperature change. Heating of the vast land masses of the northern hemisphere in northern summer reduces global cloud cover and as a result the temperature of the Earth peaks in July when the Earth is furthest from the sun. In July solar radiation is 6% weaker than in January. In January the sun is overhead the most extensive stretch of the global oceans, the south Pacific, the Indian, the Atlantic and the enormous Southern Ocean. At this time atmospheric albedo, via cloud cover, peaks. This has not always been the case and nor will it be the case in future.
15 SCIENCE VERSUS PROPAGANDA. If we want to understand the climate system we need to be concerned with both the input and the output side of the energy flows. The singular focus on the output side of the energy equation and the constant promotion of ‘greenhouse theory’ is the result of uni-dimensional thinking that is realms away from the real world. This does not represent rational problem solving behaviour. Some remarks on greenhouse theory and the inappropriate use of a single statistic to monitor a global average temperature.
16 ON BEING RELEVANT AND LOGICAL. When one looks at climate change by latitude there is very marked diversity in the warming/cooling according to the time of year. Here we look at climate change by the decade at different latitudes to escape the gyrations associated with short term oscillations. The interest in this chapter is to ascertain if there is a generalized warming that is like a groundswell, underpinning the whole. That is what would be expected under the greenhouse scenario. The upshot: If it’s there, it’s either insignificant or completely overwhelmed by other influences.
17 WHY IS THE STRATOSPHERE WARM This is a question of fundamental importance. Mainstream climate science says it’s due to the interception of short wave solar radiation. But this cannot explain the warming of ozone rich air in the polar atmosphere during the polar night when contrasting atmospheric density produces the most intense response in terms of wind strength. It can’t explain why the air above Antarctica is warmer than the icy surface below. It can’t explain the strengthened jet stream in winter. It’s inconsistent with the way that the stratosphere drives the generation of polar cyclones and produces the greatest fluctuations in surface temperature across the surface of the globe in the depth of winter.
18 THE OZONE PULSE SURFACE PRESSURE AND WIND Traces the flux of ozone partial pressure by latitude across the annual cycle as it depends upon the uplift of NOx and water from the troposphere and the descent of ozone deficient air from the mesosphere. These inflows determine the ozone content and temperature of the stratosphere against a relatively stable background of short wave ionizing radiation responsible for photolysis and the creation of ozone. Change in surface pressure across the globe results via the variation in the intensity of polar cyclones in the winter hemisphere. These cyclones owe their warm cores to ozone. A broad interactive zone between 8 and 15 km of altitude exhibits extreme variations in air density giving rise to Jet Streams. Meteorologists trace the development of the weather that is so generated at the 250hPa pressure level.

Hi Earl
There is a good graphic showing the ozone level by month and latitude that your readers may find useful in following your arguments – which I whole heartedly agree with.
http://ozonedepletiontheory.info/ozone-distribution.html
LikeLike
Hi Peter, Thank you, agreement is rare.
LikeLike
Erl, If you could marry this series of postings with the work being done by David Evans (see Jo Nova’s blog) then maybe you will have nailed it. Clearly ozone is almost ubiquitous in most of the troposphere and stratosphere. So it is in a good position to play a major part in Evan’s notch theory. Just a thought. Cheers
Rob R
LikeLike
Rob, I will have a look. But I reckon its nailed already. Ozone variability is the prime source of natural climate variation.
LikeLike
Erl, I’ll comment more when I’ve had time to digest all this.
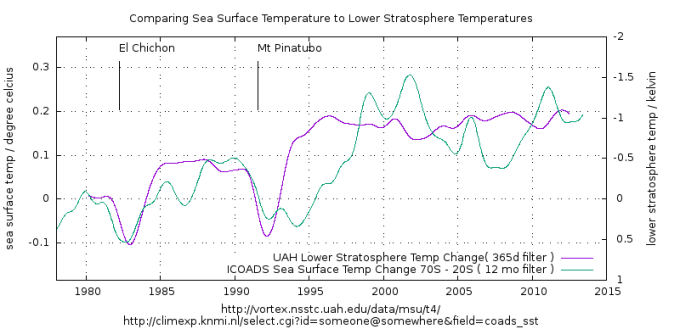
How do you interpret the effects of volcanoes on lower stratospheric temps?

https://climategrog.wordpress.com/uah_tls_365d/
LikeLike
Hi Greg, Your comments are most welcome.
Re “How do you interpret the effects of volcanoes on lower stratospheric temps?” This id not something that I have worried about but here goes, off the top of the head.
Volcanoes throw dust into the stratosphere increasing the absorption of radiation and raising its temperature.
The concurrent cooling at the surface is not likely to be due to radiation absorbed in the stratosphere but radiation reflected at cloud level due to increased cloud cover in the mid latitudes. I would look to a reduction in Geopotential height in the mid latitudes associated with a loss in surface pressure there and an increase in surface pressure at the poles promoting an increase in the inflow of mesospheric air (increased zonal wind) that erodes ozone in the stratosphere. Polar cyclone activity would diminish accounting for the surface pressure changes mentioned above. Lots of testable associations here.
LikeLike
Thanks. Initial cooling will be due to increased cloud and very early on scatter by ejecta. Sulphuric acid aerosols produce cloud seeding. I’m sure it needs to be more complicated than that.
What is interesting is what happens after the initial blips. The long term counter effect seems undocumented so far in mainstream accounts of volcanic forcing.
As the aerosols are purged TLS drops to cooler than were it was initially. Concurrently the surface warms though with a long time constant which can probably by attributed to thermal inertia of oceans.
You like SH data , here is SH SST as a calorimeter for the same period
LikeLike
Indeed there is a close relationship between the temperature of ozone affected air at 500hPa, 300 hPa, 200 hPa, 100 hPa and higher and the temperature of the surface of the sea and the relationship gets better and better as the focus gets closer in terms of defined latitude bands. This is the same as saying that there is a relationship between geopotential height and surface temperature. I analyse that situation and talk about the dynamics here: https://reality348.wordpress.com/2015/12/29/3-how-the-earth-warms-and-cools-naturally/
LikeLike
It would be good to have much larger graphics. The size is fine for the text but it would be good to ba able to click to get a bigger clearer version. Zooming with the browser just gets a larger blurred graph. They are legible but it’s an effort, which impedes reading and understanding.
LikeLike
Tell me how to do it and I can try. I am using a snipping tool that has relatively low resolution to create a JPG that will load into WordPress.
LikeLike
It depends what you source image is. By snipping I guess you means screen capture , is that correct?
If you are copying from a site that has low res there may not be much to do though always do a browser zoom or view the image alone rather than in the context of HTML which will likely be scaling it to fit.
If it’s a PDF paper , zoom in before doing the screen cap.
If possible save to PNG not JPEG which always further deteriorates the image.
If you add a larger image to WordPress it will scale it to fit layout, so I like to provide a link to the full sized image as well. If you read my articles, you can click on the graphs to get them alone and full size.
Does that tell you enough?
LikeLike
Greg, I use a little program that comes with windows called ‘snipping tool’. Its not screen capture. Very useful. You outline what you want and it captures just that portion. Before I had it I used to go through a laborious process of creating a PDF and saving as a JPG file. It does give me the option of saving as PNG and here is a sample: https://reality348.files.wordpress.com/2016/06/uv-spectrum.png
If there is a particular diagram where you would like the detail I can repeat the exercise and try for a better result. Thanks for the advice and I will try to improve.
LikeLike
That graph is not labelled in um ! It is wavenumber, not wavelength.
1100 per cm = 110000 per m = 9.1 um
980 per cm = 98000 per m = 10.2 um 😉
LikeLike
Thanks. You have discovered my lack of an education in maths and science. But that does not affect ones ability to observe change, make associations and think things through. Does the error disqualify the argument? Ozone is unarguably a greenhouse gas that absorbs at near the peak of energy emission in terms of wave length by the Earth system. Wherever that ozone molecule is located it will absorb at 9-11nm.
LikeLike
It was a technical error that you may want to correct. The wavenumber thing does not affect the argument.
One thing that was questionable and needs justifying with numbers was the claim that Earth unquestionably out plays the sun.
900nm may be nearer the peak of Earth’s 300K emissions than the peak of 5000K solar emissions but don’t forget this is T^4 !! I have not checked but would guess that even the tail of the solar spectrum out-weights the terrestrial peak.
I think you need to check that assertion. That is critical to your point.
LikeLike
Greg, Yes, the Earth is a sphere that rotates about the sun and it spins on an axis that is tilted to the plane of its orbit. I would see the infra-red terrestrial radiation being a stronger contributor to the temperature of the atmosphere than ultraviolet from the sun at lower elevations more than at higher elevations. As to which of these two influences dominates at a given altitude and according to variation in hemisphere and latitude that is a question that nobody addresses. There is no doubt that during the hours of darkness and during the polar night it is infra-red from the Earth that dominates as a contributor to atmospheric warming via ozone and other absorbers. Observation will answer this question and the proportional contribution of infra-red will be different according to hemisphere, season and time of day. If there is a computer model that can answer that question it will have to be pretty special. I wont trust it. Stuff the models, I will work this out by observing relationships.
Unequivocally, and especially in the winter hemisphere there is an identity between the ozone content of the air, the temperature of the air and geopotential height below the point of measurement as one observes here: http://www.cpc.ncep.noaa.gov/products/stratosphere/strat_a_f/
What is important is to reject the notion that the temperature of the ‘stratosphere’ (we can go into the location of the ozonosphere as a separate issue) is not governed simply, surely and 100% of the time, by the impact of short wave energy from the sun.
And this is a very important issue because it is in the dead of winter that surface temperature varies most strongly. So, I can say with confidence that in January, UV radiation plays a minor role in determining the temperature of the ozonosphere north of 50° north latitude. The entire UV spectrum contributes 8% of Total Solar Irradiance at top of atmosphere. The infrared spectrum that carries the entire burden of the radiation returning to space. Energy out = energy in. That energy out is pretty tightly focussed about the wave length that excites ozone.
Other compounds also absorb in the infrared but there is little water near the poles in winter. Only water and ozone are not well mixed. It is to these two that we must look to explain the forces behind the movement in the air.
LikeLike
I had not considered the pressure broadening argument for ozone.
The total energy absorbed is the area under the absorption graph, so I’m doubtful that broadening will necessarily increase the total absorption. There are still the same number of molecules at work.
This needs to be checked with an atmospheric model like MODTRANS rather than guessing. This sort of thing is understood to a high degree of accuracy from military research, not climatology. It can be taken seriously.
My intuition is that the relatively low ozone in troposphere will not be a significant player.
LikeLike
To understand the role of ozone in the troposphere one has to comprehend the movement of the atmosphere in high latitudes in winter. Ozone proliferates for a number of reasons and a strong gradient in atmospheric density establishes across the polar vortex, ozone on one side, virtually no ozone on the other. Antarctica, by virtue of the distribution of land and sea is the archetypical model. Warming of the air at and above 200 hPa is material to the development of polar cyclones that elevate warmed air to the top of the atmospheric column. What goes up must come down. Some comes down over Antarctica but most of it comes down in very broad high pressure cells of descending air in the mid latitudes. That air is compressed as it descends, its dry and relatively cloud free. However there is a lot of flow in the air across the latitude bands and some intermixing that gives rise to cloud. Add ozone to the mix and you see the cloud evaporate. Increase the volume of air descending and the area affected by high surface pressure and low cloud cover expands. In the southern hemisphere there is a lot of water to absorb the energy from the sun.
In the upshot, at 20-40° south latitude when GPH increases at 200hPa it does so also at 500hPa and 700 hPa and the surface warms. If you look at the temperature of the air at these altitudes the greatest fluctuation occurs at the highest pressure level….another example of the highly mysterious ‘amplification’. No, its not mysterious at all. Response is always greatest closest to the stimulus.
LikeLike
Spectral broadening can be significant when the spectral absorption is near saturation. This is the case for CO2. The molecules start to mask each other and adding more makes less and less difference. Spectral broadening means that they are spectrally spread out and can have more effect.
At a few ppm the same thing will not apply much to O3. As you can see from your graph the 9-10 um slot is far from saturated though it does show quite a broad ‘line’. . If you can find absorption spectra for different pressures you should see this but the real world is complex and it needs checking with a complex tool like MODTRAN / HITRAN . I don’t have a link to hand but you may find an online interface. The one I used has disappeared.
LikeLike
Greg, ozone absorption is pressure sensitive. I have read that as much energy is absorbed by ozone in the troposphere as in the stratosphere. Ozonsonde data in mid and low latitudes shows sensitivity at 6 ppm when there are well differentiated layers of different ozone content adjacent in the vertical dimension. In the lower latitudes of the southern hemisphere under a high pressure regime there is an ozone hole between 10km and 23 km as severe as the Antarctic in October. But below 10km ozone partial pressure can vary up to 6 ppm perhaps due to descent from the stratosphere. Gordon Dobson remarked on the dryness of this sort of air, a signature of its origin. Off to bed. its after midnight here.
LikeLike
All I have to do is inspect the radiosonde data. https://i1.wp.com/reality348.files.wordpress.com/2016/06/huntsville-alabama-9-april-2016.png?ssl=1&w=450
Response in the temperature curves at 4 ppm ozone.
The way I see it is like this. The ozone molecule loads up. It’s ability to download depends upon the distance to a candidate to accept the parcel. Its a pass the parcel exercise. Same applies in the thermosphere. Lack of a candidate to accept the parcel results in extreme energy loads and a ‘spray zone’. Escape from the Earth’s environment becomes possible.
LikeLike
Verging on a rant here. Ease up on the polemic and concentrate on presenting your argument about ozone.
Firstly you are confounding two things. Does back radiation exist ( the physics of absorption, emission and transmission is well studied. I don’t see much reason to cast doubt on that ); does it have a measurable effect on surface temperature? The latter depends above all on feedback reactions of the climate system to changes in radiation. Convection , sure, changes in cloud cover, many factors which have not been properly investigated because of dogma, as you rightly say.
In an observationally based study, I show that volcanic forcing has been incorrectly scaled down since early 1990s in order to maintain higher climate sensitivity to radiative forcing.
https://climategrog.wordpress.com/2015/01/17/on-determination-of-tropical-feedbacks/
Clearly radiative forcing does exist, the question is in the climate reaction to change : climate sensitivity. It is foolish to suggest that the concept of radiative forcing is “spacious” , it is rather a question of how much effect it has.
If pottery ‘fires’ in a kiln it is due to radiative forcing. The maximum temperature at which the work stabilised, depends on the Planck feedback. 😉
LikeLike
Greg, I am aware that I am out on a limb here. I don’t mind that at all because I see no evidence of ‘radiative forcing’ below a mid latitude tropopause that is warmer in winter due to enhanced ozone content of the air at a time when the surface is at its annual minimum temperature. That warming should be reflected in the geometry of the isotherms at pressure levels below the warmed layer. It’s not.
I think of the radiative forcing argument in terms of the effect of a blanket that is an insulator. It’s an insulator because it retains the energy emitted by the warm body by trapping warm air within lots of fibres. The closer the contact with the blanket the better the retention and the smaller the heat loss. The operative word is ‘trapping’. The atmosphere is gaseous and its mobile in both the vertical and the horizontal with strong thermal gradients in both directions.
In addition the atmosphere is thin. Half of it is within 5.5 km of the surface.
Add to that the effect of the wind chill factor that reflects the rate of removal of photons of energy via direct contact.
Add to that the cooling effect of evaporation and the wetness of the planet’s surface and the super-evaporative activity of vegetation.
So this particular model of ‘radiative forcing’ is like a lot of others in climate science. It falls down because of the assumptions it makes. I see no effort to incorporate the factors that I have mentioned in the preceding sentences to assess the potential for energy exchange or return of that energy to source so I dismiss this theory as a half baked notion that is a product of people who know little of the geography of the Earth, the importance of its rotation about the sun, the inclination of the spin axis or the habits of the winds. And how those habits have changed over time to modify the thermal gradient between the equator and the poles. That’s where the real mechanisms of climate change work their wonders.
I see no evidence of an interest in climate history or the identification of those parts of the globe where change seems to originate and no interest on why that might be so. There is this silly concentration on a single aggregated global statistic. Stupid stuff.
But there is a heap of other stuff that leads me to dismiss it based on my observations of the way that things happen. CO2 advances monotonically. Temperature has both advanced and retreated over the period where we have good data. Its rate of increase is different according to hemisphere, latitude and month of the year. I have covered this in earlier posts https://reality348.wordpress.com/2016/01/13/7-surface-temperature-evolves-differently-according-to-latitude/
https://reality348.wordpress.com/2016/01/15/8-volatility-in-temperature/
And then there is the so called ‘hiatus’ in temperature advance since the turn of the century. Finito.
Unless we can account for natural climate change and can be sure we have it quantified we have no business attributing anything to ‘radiative forcing’ or any other hare brained idea.
So, my message is to go back to the start of the investigation and examine the patients spots. That’s what I do here.
I think I have every right to be indignant. I am actually very angry at what is going on. I don’t think people are behaving with good faith. It’s far from what I would hope to get from ‘science’.
LikeLike
I agree with your last statement. I’m quite angry about all this crap too and I used to consider myself an environmentalist.
However, I’m saying you should differentiate whether radiative forcing exists, from whether climate can counteract it. Not the same thing.
I think climate, especially tropics, is highly INSENSITIVE to radiative forcing, which doubtless does exist.
There is a very mild warming of the tropical mid-troposphere but it’s negligible. Not at all in line with the “hot-spot” of predictions.
LikeLike
Agree, climate in the tropics is insensitive to radiative forcing because other modes of cooling dominate. Evaporation, condensation aloft, uplift. So, paradoxically the air at 15km in elevation over the equator is at -85°C, about as cool as the air over Antarctica at 50 hPa in the middle of winter.
Radiation peaks over high pressure cells in the winter hemisphere. If there is a residual warming effect due to back radiation I will happily accept it thank you very much.
But inspect the temperature profile at different elevations and see if you can detect it happening. Test bench is offered by a warm tropopause, warmer in winter by about the same margin as the surface cools between summer and winter.
LikeLike
Be careful, this is sounding dangerously close to Doug Cotton style, 2nd law, nonsense.
The concept is that cooler air can slow down the radiative cooling of warmer air. There is nothing ‘ counter-intuitive’ about that. The blanket on my bed can not be warmer than I am but it stops me getting cold.
I think there may be something interesting in what you are saying but be careful not to undermine it with such ill-founded comments.
LikeLike
If you can slow down the radiative cooling and the incoming flux does not change the equilibrium temperature will rise. This should not be confused with the second law of thermodynamics which states that heat can not flow from a colder object to a warmer object with which it is in thermal contact.
LikeLike
Yes we can slow down the radiative cooling if we immobilize the atmosphere. But if we can not, then we are chasing a ‘will o the wisp’. When it leaves it does not come back and it takes it does so without giving.
LikeLike
If something slows down radiative cooling it will cause warming. That warming may itself increase something like convection to compensate. The radiative cooling is still reduced.
As a general rule on feedbacks ( which is what you are suggesting ) they never totally remove deviation from equilibrium that caused them, they just reduce it. This is probably why there is a weak ‘hot spot’ not a hot one. It is mostly annulled by a feedback, : convection or changes in cloud cover.
A strong feedback reduces more of the perturbation than a weak one. The residual may be undetectable in a noisy system.
LikeLike
Glad to think that you are thinking about blankets. Yes, think about insulation and how to make it effective. If there is any insulation to be had in the atmosphere tell me where it is….I could use some of the good stuff.
LikeLike
You said on Clive Best’s blog:
So I assume that you want properly sceptical comments.
Your Hollmover diagrams show that the strongest warming happens over the Australian continent, yet there is barely a trace of this in the stratosphere. The cold zone seems to align with the cold, clear air of the Andes rather than the Pacific coast. This is seen in the stratosphere plot.
This indicates that that the stratosphere is *only* affected by surface temps in this very unusual part of the world with very particular optical transmission, well appreciated by astronomers. You seem to take this as proof that the same thing applies globally while your own evidence shows otherwise.
Probably more than you bargained for. Consider it a bonus. 😉
LikeLike
Lke yourself, I consider that the Stratsphere and ozone are key elements in understanding recent climate change. I’ll wait to see how you react to these comments.
Best Greg Goodman.
LikeLike
Greg, you are a tonic. Thanks immensely for taking my writing seriously. In my experience very few people care to engage. Perhaps its a lack of confidence. Perhaps its my aggressive style. But underneath, rest easy, I am just a pussycat.
I have a biting cat. When she bites I put it down to an excess of love. But it could be related to electrostatics because she is long haired.
Every comment is valuable and the sceptical comments especially so. Best to you too. I hope that you can be part of the exploration. So far not one comment has been received that addresses the substance of this post: https://reality348.wordpress.com/2016/05/14/23-the-dearly-beloved-antarctic-ozone-hole-a-function-of-atmospheric-dynamics/
Next post I try and address the factors responsible for the distribution of ozone below 1hPa. The one after that I want to devote to the question as to how the dynamics responsible for the Antarctic ozone hole play out in the northern hemisphere, producing a fizzog at each attempt.
LikeLike
Its not the temperature at the surface that is reflected in the temperature at 10hPa. Its the rate of interception of long wave energy that is reflected in the temperature of the stratosphere. Those cold waters off South America have a low rate of evaporation and a big high pressure cells that has no cloud to intercept long wave radiation is located directly above. So, long wave emissions are relatively strong in this particular zone and 10 hpa temperature reflects this fact.
But, how the stratosphere at 10hpa temperature comes to be warm or cold is not of any particular interest. The fact is that it reflects surface patterns. The only way it can warm or cool with so well defined a pattern is via the interception of radiation. If it were left the the air and the winds in contact with the surface all those little differentiations that we see at 10hPa would be obliterated via mixing processes. Is the air supposed to convect through the stratosphere? No. In places it does, driven by ozone warming but not at these latitudes.
99% of the atmosphere lies below the 10 hPa pressure level. Ozone is present and regulates the temperature in both the stratosphere and the mesosphere and you can be sure that as altitude increases the impact of the Earths own radiation affects the temperature of the air wherever ozone is present. The important thing to note is that the temperature of the air at 10hpa is not simply a function of heating due to incoming radiation from the sun.
What is the energy that can be imparted to the atmosphere by ozone by virtue of its attenuation of the power of radiation that leaves the Earth and its atmosphere when that radiation is fairly tightly focussed about the spectra absorbed by ozone? When ozone partial pressure peaks over the cold waters at 50-60° south latitude in winter when extremely cold dense air occupies the polar cap how does the difference in air density that manifests at 7-23km in altitude affect the circulation of the air? Is it a coincidence that this is where Polar cyclones develop. Is it a coincidence that surface pressure falls to its annual minimum in October when the ozone hole manifests? Why has surface pressure fallen by more than 10 hPa over high southern latitudes in the last seventy years. What causes the ‘annular modes’ of inter-annual climate variation this is recognized as the major mode of climate variation that the Earth experiences bar none? What causes atmospheric mass to move between high and mid altitudes and across hemispheres? Why is the Antarctic experience so much more dramatic than the Arctic?
LikeLike
There is a heck of lot of material here and it may have something interesting. So I picked on a part that I’d already some familiarity with to see whether it hangs together. I’ve spend years working on climate but don’t have time to research everything which comes along.
Sure but you are trying to work out where that radiation is coming from. You have shown evidence that in one, very atypical region, there seems to be a clear signal from the ground. This is the very dry Andian climate ( I don’t agree this is over the ocean from what we can see ) . You may find a similar effect over the Himalayas. It may even be from the Antarctic peninsula, since all you have there is longitude. What is the ozone profile over the Andes?
It would be helpful to link sources for all this stuff. Where did you get the Hollmover diags from?
This raises the question what is happening elsewhere. Why does the Aussie hot spot not get through?
Is the rest dominated by solar heating from above?
The likely answer seems to be water vapour is blocking. That needs checking in the H2O spectrum. This may also be a reason why the poles are important. Antarctica is totally dry air. This could be what allows O3 to dominate.
LikeLike
Yes H2O is quite strong just below 1000nm
This may be of use for you. It’s a bit slow but looks like it gives online access to HITRAN
http://hitran.iao.ru/
LikeLike
That graph is not really detailed enough. It came from that HITRAN ;link apparently. You could try to get a more detailed plot of that section of the spectrum from 8-11 um. It’s quite busy with some H20 vapour, come CO2 and ozone lines.
Again pressure broadening may be significant. Less chance of overlap at higher altitudes where lines will be narrower.
I’m guessing from the Hollmovers that W.V. is blocking for all but driest regions. This may contradict your ideas over the Antarctic but you do need to follow through on this. You seem to have been drawing incorrect conclusions from the Hollmover diags having seen a very localised effect.
If you can give a link to where you got them, it may be interesting to see what they show for other grid coords, like Antarctic peninsula ( I’m pretty sure that its Andes we are seeing but you could confirm that ) also look at Himalayas and Antarctic to see whether there is a similar sign of surface signal getting through to 10 hPa.
You need to be ready to modify your conclusions in the face of contrary evidence , not fall into the fixed ideas that you have been slating climatologists for having.
LikeLike
Greg, The source page has changed. Its now at http://www.esrl.noaa.gov/psd/map/time_plot/ and the old page where I got that hovmoller is now only functional for the surface. At 10hPa in the latest presentation there is an anomalous warming over the continental landmasses of Africa, Australia and South America (dry country in Argentina) at 20-40° south. There is a clear signal in the stratosphere at 10 hPa that relates to the nature of the surface, the land in summer giving off more radiation than the sea. That says to me that ozone at 10hPa is excited by infra-red radiation from the Earth and different levels of radiation acting on the same amount of ozone yield temperature differences at an elevation where 99% of the atmosphere lies below. I have no reason to expect that this signature from the surface would not be present also at the mesopause. The notion that the temperature of the stratosphere is simply a function of short wave radiation from the sun is plainly invalid. Apart from the contribution of the temperature and density of the air due to the activity of ozone as a greenhouse gas we have also to understand the movements in the air within the ozonosphere in order to understand the distribution of ozone and the pattern of atmospheric density that results that mobilizes the wind. In fact density differences are associated with marked differences in the ozone content of the air between about 7km and 23 km in elevation where the strongest winds are to be found. The patterns in the ascent and descent of ozone becomes a matter of considerable interest because it will very much affect cloud cover. Look here:http://www.cpc.ncep.noaa.gov/products/stratosphere/strat_a_f/gif_files/gfs_o3mr_400_sh_f00.png This is new. Last time I looked there was no data below 100 hPa. It’s from http://www.cpc.ncep.noaa.gov/products/stratosphere/strat_a_f/
Ozone drives the temperature and density of the air well below the tropopause. It is below and above the tropopause that the synoptic situation is driven. Surface pressure is driven by the flux in ozone between 7 and 23km in elevation.
LikeLike
“Fortunately, observation can settle the matter informing us as to the source of the warmth in the stratosphere.”
Thanks for the source link. Looking closer at the annotations on your Hollmovers, the 10mbar one is *reanalysis data* , there is no observational data at the height. So that is model output informed by measurements from lower levels. Caveat emptor.
Oddly, though I can request what you did I now get delivered black rectangle!
The nearest working level produces a plot which has no sign of the features seen in what you were able to get. I’m inclined to think this is a model artefact. In any case I will not give it any weight if their model is not longer even producing the plot.
Your original plot did not transmit the continental warming over Australia , now you say the current one does. Rather throws the reliability of what NOAA are doing with the data into doubt.
Remember reanalysis “data” is basically model output infilling a extrapolating from real data If it’s a height with no data , it’s ALL model output.
LikeLike
Black rectangles or no rectangles result when you ask for any more than 2 years data. The earlier version could deliver on more extended time periods if you waited.
All climatic data depends on extrapolation between points of actual observation that, when you get to the atmosphere are like hens teeth…..extremely rare. Its fashionable in certain circles to decry reanalysis data. Satellites provide data for much of the atmosphere between the surface and beyond 10hPa and are far more reliable on a day to day basis and a rotational basis than anything that we ever had before the satellite age.
In any case, if you want operational data go to 50 hPa and you will see stream action reflected. The ozonosphere at this elevation is very mobile and exhibits lots of texture along lines of latitude. That’s twice the height of the tropopause in the mid altitudes and presumably within the reach of ionising ultraviolet radiation….or is it? Have a look at 30-40° south latitude 2014 and 2015. See the difference between the two summers. Is that explainable in terms of variation in UV radiation? Is a 16°C variation in the temperature of the air in summer at 50 hPa explainable in terms of heating by either UV or variations in surface temperature? What ‘operational’ observations could this data be based on at 30-40° south latitude where most of the surface is the just the rolling waves of the Southern Ocean that varies in temperature by at most 6°C.
All climatic data is extrapolated. Its all from a model if you want to call it that. And reanalysis data takes into account all dimensions and all the relationships between the many variables that are part of the model. lets face it, its probably as good as we will ever get until the model itself is changed. There are known diversions in particular places with particular models and that’s a matter of constant interest.
Lets not throw the baby out with the bathwater. There are other observations that are made in this chapter that are material to the argument.
LikeLike
It is instructive to examine the temperature of the air at each available level, and in particular above 50 hPa where we see a gradual disappearance of stream function although it is still present in winter at 10 hPa, not so in summer where the circulation in the stratosphere is very much slowed down. The signature of land mass heating only appears in summer when the atmosphere at 10 hPa is relatively still. That’s what I observe here: https://earth.nullschool.net/#2015/09/08/0000Z/wind/isobaric/10hPa/overlay=temp/orthographic=82.12,-32.87,385/loc=176.745,-25.060
The choice of location is deliberate because at 30-40° south the continents are but a fraction of the latitudinal circumference. Its set up for contrast.
LikeLike
“The notion that the temperature of the stratosphere is simply a function of short wave radiation from the sun is plainly invalid”
Who is making that assumption. I have read that the reason for the cooling of TLS in recent decades was due to GHG blocking the upward IR thus cooling TLS. This is what I was questioning with my TLS analysis which shows this is mostly due to volcanoes ,not GHG.
The false attribution only comes from their never ending attempts to draw straight lines through every dataset then make spurious untested causational links from trivial correlations between ‘trends’.
LikeLike
Those making the assumption/propagating that notion get a mention at the start of the chapter. As for the cooling of the stratosphere over the tropics well that may be due to more NOx and water entering the stratosphere due to enhanced convection from below as tropical waters warmed by 1°C very promptly after 1978. If one examines the evolution of temperature at 850 hPa over the tropics that is where the warming is most apparent….in the condensation zone. Acceleration of the water cycle. Enhanced release of latent heat. More clouds, more interception of OLR at cloud level, heating driving convection.
LikeLike
Did you actually read the article I linked about the effect of volcanism on TLS?
LikeLike
where can I see this prompt warming in 1978 ? Data, not broad brush conjecture.
LikeLike
Greg, I am a bit lost. Not sure where the reference to ‘prompt warming’ lies.
Fifth diagram in chapter above shows warming in 1978 at 200hPa.
Perhaps this may help: https://i0.wp.com/reality348.files.wordpress.com/2016/04/change-in-temp-at-10hpa-by-month.jpg?ssl=1&w=450
or this: https://i0.wp.com/reality348.files.wordpress.com/2016/03/temperature.jpg?ssl=1&w=450
I did look at at your article but in the hurly burly of comments I did not give it a lot of attention. You are aware that I am not a believer in the notion of radiative forcing in that I don’t believe the atmosphere will behave as is suggested unless its static and can not move. Apart from that, as you are aware I tend to glaze over when mathematics is introduced into the argument. So, I am not equipped to comment on any aspects of the paper that relate to ‘forcings’.
Looking at your article now with more attention:
Figure 1 A very interesting observation. Suggests a system that has lost some of its ability to regulate itself. Why? At this time surface pressure in Antarctica hit rock bottom and the polar vortex (zonal wind in high latitudes) no longer showed a reaction to change in atmospheric pressure. After 1998 this situation that had prevailed most of the time between 1978 and 1998 began to recover and increases in polar surface pressure elicited cooling in the Antarctic stratosphere. Back in the fifties that response to surface pressure change was evident in both summer and winter. So, the climate system is constantly changing and unless the modellers realize that, and they don’t, there is little hope for them.
Would the top of Atmosphere radiative flux in the tropics in particular not vary with the relative contributions of evaporative cooling and convection to the cooling process in the tropics? A lot of the climate system response to energy absorption is found in TOA outgoing infrared radiation, not over the tropics where radiation is weak, but rather, in particular, the zone of high surface pressure in the mid latitudes of the winter hemisphere. That’s where the heat of compression energises the atmosphere to deliver outgoing radiation in a relatively cloud free environment. Very little water vapour in that particular atmospheric column.
When people use a lot of abbreviations I get lost. AOD, TLS etc.
You note: ” NASA Earth Observatory report [13] that after Mt Pinatubo, there was a 5% to 8% drop in stratospheric ozone. Presumably a similar removal happened after El Chichon in 1982 which saw an almost identical reduction in TLS.
Whether this is, in fact, the cause or whether other radiation blocking aerosols were flushed out along with the volcanic emissions, the effect seems clear and consistent and quite specifically linked to the eruption event. This is witnessed in both the stratospheric and tropical tropospheric data. Neither effect is attributable to the steadily increasing GHG forcing which did not record a step change in September 1991.”
In my understanding of climate processes the loss of ozone will in itself be sufficient to produce cooling. But to understand how that happens you need to start at the beginning of my work, not in the middle. Chapter 3 gives you a crash introduction but don’t ignore chapter 2 that gives you an account of how I got to the place I am in.
One has to have a basic understanding of the climate system in terms of where the energy gets in and out and the factors responsible for the equator to pole temperature gradient and what causes changes in that gradient to actually make progress in this field. The factors you mention in the following passage are indeed very important: ” so these tropical/ex-tropical variations can also be seen as part of the climate response to the volcanic disturbance. ie. the excess in horizontal net flux, occurring beyond 12 months after the event, is also supporting restoration of the energy deficit in extra-tropical regions by exporting heat energy. Since the major ocean gyres bring cooler temperate waters into the eastern parts of tropics in both hemispheres and export warmer waters at their western extents, this is probably a major vector of this variation in heat transportation as are changes in atmospheric processes like Hadley convection.”
Re: Figure 11. Part of fig.2 from Thompson & Solomon 2008 showing the relationship of ozone and TLS. yes ozone partial pressure and temperature in the lower stratosphere go hand in hand because the former is responsible for the latter. A thousand million radiosondes can’t be wrong.
Not at all sure that these comments are going to be seen as relevant. But rest assured I value your interest and your comments and I hope that we can continue to converse. Much better than mumbling to oneself.
LikeLike
Thanks Erl. Those graphs do seem to show a notable fast change which is clearly outside the usual variability. If that is real I would start looking for an external cause: solar flare, CME coronal mass ejection, or similar.
The problem is, as I pointed out with the Hollmovers that these higher levels seem to be the result of model output in the absence of observation. Since this is the exactly the sort of thing that models get wrong and where they are based on non-validated assumptions, I give them very little weight.
They are at best extrapolations from lower level data using a model which has never been validated since there seems to be a total absence of data.
IIRC, the highest level for which NOAA have data is 50mbar. There is little evidence of this step change at that level, so most of what is seen higher up is probably an artefact of dubious ( to be kind ) extrapolation.
Most of the climate scare is about TOTALLY unjustifiable extrapolation, way outside the period of observational data. This has no scientific merit whatsoever.
There was a blip in AO in 1989 that is reflected in Arctic melting season.
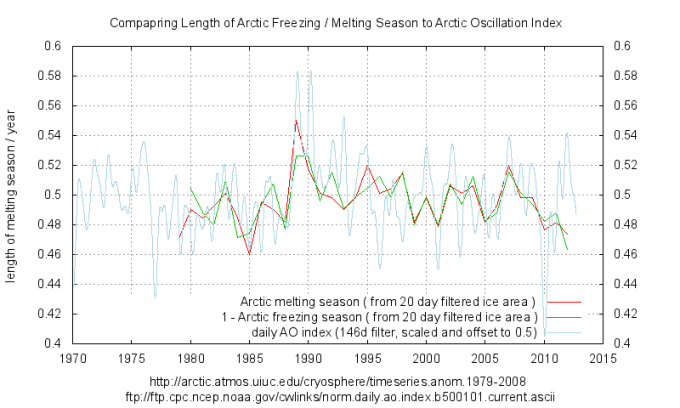
https://climategrog.wordpress.com/arctic_freeze_melting_daily_ao/
There is also a drop in 1977 which may be related changes in SH.
The is also quite a lot of similarity between Antarctic melting and Arctic three years earlier.
https://climategrog.wordpress.com/ant_arctic_melting_season_lag/
I think that this is the origin on what is often referred to as Polar see-saw : the idea that they generally go in opposite directions. This seems to show that it is more likely a time lag than actually opposing phase.
This comes back to the point we are both making about change starting where the change is greatest. That is not necessarily the case but is certainly what should be regarded as the most obvious assumption.
LikeLike
The strongest climate *response* is in the tropics, that is why it is so stable despite variations in incoming solar and supposed changes to radiative ‘forcing’.
You seem to confuse lack of an effect of radiative forcing due to strong feedbacks cancelling it out with the idea that the radiative forcing does not exist in the first place.
The is more evidence of changes in extra-tropical regions precisely because there is less feedbacks there. You need to chose your words carefully. There is more *effect* on climate where there is less climate response.
This maybe a result of your admitted weakness in the physics/maths domain.
With your background in agriculture, you may be able to relate to the following analysis of volcanic effects based on degree.days ( mathematically the integral of daily temperatures ).
https://climategrog.wordpress.com/hadcrut4_stack_cdf_sh_zeroed/
There is a click-through series of graphs for tropical and extra-tropical regions in each hemisphere and comparing land and sea. This clearly shows the tropics are more stable than higher latitudes. ie volcanoes ( one type of radiative forcing ) have more *effect* outside the tropics.
The climate *response* is strongest in the topics and totally cancels the effect after a few years. It is interesting to note that not only does the topical climate re-establish the temperature, it also seems to recover for the lost number of degree.days, causing an equivalent number of warmer that average days to make up for the loss.
LikeLike
Re: “You seem to confuse lack of an effect of radiative forcing due to strong feedbacks cancelling it out with the idea that the radiative forcing does not exist in the first place”. and ‘The is more evidence of changes in extra-tropical regions precisely because there is less feedbacks there. You need to chose your words carefully. There is more *effect* on climate where there is less climate response. This maybe a result of your admitted weakness in the physics/maths domain.”
I think it’s you who needs to choose your words carefully. I am struggling to extract any meaning from your words above.
The only way the Earth can lose energy is via radiation to space. Incident energy is most plentiful between the tropics of Capricorn and Cancer. The sun is almost directly overhead. There is little cloud in low latitudes to scatter and return energy to space. The tropical latitudes respond with growth of vegetation, evaporation and uplift, all energy absorbing processes. Evaporation and uplift is greatest not over the sea but over rain forests on land. The air contains a lot of water vapour that is frequently releasing latent heat and getting warm in the process. That’s why, under an increase in energy loading the increase in the temperature of the air in the tropics is much greater at cloud level than it is at the surface of the sea. The downward flux in energy is shown here: http://ds.data.jma.go.jp/gmd/jra/atlas/en/surface_ex.html The tropical latitudes exhibit a strong flux in downward radiant energy. That downward flux does not seem to be capable of eliciting much of a response in terms of surface temperature.
The tropics efficiently transfers energy to higher latitudes and under a regime of increasing global temperatures the least increase in sea surface temperature (on a decadal basis) will be observed in tropical latitudes. Firstly, the Ocean currents transfer much of the energy that is stored in the ocean to higher latitudes and without this energy transfer the equator to pole temperature gradient would be much greater than it is. In addition, rising air cools via expansion, not radiation and it returns to the surface via the descending air in high pressure cells across a wide band of latitudes and most especially in the winter hemisphere. Toggle across the months here: http://ds.data.jma.go.jp/gmd/jra/atlas/en/surface_ex.html This is where top of atmosphere radiation peaks and that radiation emanates from cold dry air.
If the tropics showed a strong response to enhanced incident energy, accruing perhaps via an increase in the cloud free area (expansion of the Hadley cell) to the extent that all the incident energy were to be returned to space within those same tropical latitudes then the flow of energy to higher latitudes would be no different than prior to the increase in energy supplied to the tropics. The equator to pole temperature gradient would increase reflecting the extra energy stored in tropical latitudes mainly via an increase in the energy stored in the sea.
In practice the Earth system transfers much of the energy that accrues in the tropics to the mid and high latitudes. In consequence the change in surface temperature as the climate system gains or loses energy is much greater outside the tropics than within the tropics.
Radiation from the top of the atmosphere that vents energy directly to space is concentrated not in the tropics but in low and mid latitudes where dry air descends. The seasonal peak occurs in winter, when, if this radiation were capable of increasing surface temperature (via back radiation) the result would be highly beneficial. For instance, at 33° south latitude overnight temperature tonight is expected to be 6°C.
If I may be permitted an observation it is that those who express their mathematical skills in analysis of the climate system would be less confident in their prognostications if they were to try and gain a basic understanding of system dynamics and begin to look at the Earth rotating in apace about the sun rather than as a slab.
Not sure what you are referring to as the ‘integral of daily temperatures’ or how you manipulate the data to achieve it so I am sorry, I can’t comment.
\Greg, did you look at this: https://reality348.wordpress.com/2015/12/24/2-assessing-climate-change-in-your-own-habitat/
LikeLike
You have said a couple of times that you don’t think that radiative forcing exists. I’m nut sure that is what you intend to put forwards. I think that it is pretty well established physics that the radiative effect exists. otherwise we need to call into question lots of basic laws of physics on absorption , emission and transmission of radiation .
The point you make about the fluid nature of the atmosphere, convection and conduction are really saying that the climate system has other ways to compensate for any radiative forcing which is true, most clearly in the tropics.
It’s a choice of words, but if you say that radiative forcing does not exist, you are not going to find many that give you a second reading.
LikeLike
Erl, are you agreed that all the 30mbar and higher “data” are just model extrapolations from lower altitude observations?
LikeLike
Hi Greg, Sorry for late reply, been away for a few days.
The temperature increase is there at 50hPa. See http://www.esrl.noaa.gov/psd/cgi-bin/data/timeseries/timeseries.pl?ntype=1&var=Air+Temperature&level=50&lat1=-70&lat2=-90&lon1=0&lon2=360&iseas=0&mon1=0&mon2=11&iarea=1&typeout=2&Submit=Create+Timeseries
The temperature increase in high latitudes increases with elevation due to the convection of ozone warmed air so it is much more at 10 hPa than at 50 hPa. When that reanalysis was presented by Kalnay in 1996 he had the benefit of all the satellite data that had accrued after the 1960s. You can set up a model of the atmosphere based on a single years data if you want to. These guys had very good data for the previous thirty years to check out relationships like the relative increase in temperature at 10hPa for a given increase at 50hPa. Also the temperature increase to be expected at 10 hPa or at 200 hPa at 20-30° south when temperature increased by X degrees over the southern or northern polar cap.
All data results from model extrapolations, even at 50 hPa.
The characteristics of the atmosphere at any particular place depends on its character at all others. So the cross checking that can be done is actually very comprehensive. As the temperature of the southern stratosphere increased between 1948 and 1978 surface pressure in high latitudes fell way as would be expected. It does so from a thermal effect and a vorticity effect due to the enhancement of polar cyclone activity. As surface pressure falls in high latitudes it rises in the mid latitudes and across the remainder of the globe. Where pressure builds depends upon what’s happening in the Arctic concurrently and what’s happening over the vast land masses of the northern hemisphere in terms of heating. The relationships between the temperature of the atmosphere over the pole, surface pressure at ground level over the polar cap and elsewhere including the mid latitudes of the southern hemisphere depend upon the month of the year, more accurately the day of the month.
As surface pressure fell in high latitudes (with the increase in ozone and temperature above 100 hPa) it increased in the mid latitudes of the southern hemisphere. That’s where I live. The increase in pressure at these latitudes is well observed at the surface, as is the 15-25% decrease in rainfall that resulted from reduced frontal activity. The change in the climate here is directly attributable to the change in surface pressure.
Re the radiative heating and whether people are going to give me a second hearing or not. Well, lets assume that there is another mode that can completely explain the change that has occurred. Should I be giving the benefit of the doubt to radiative theory when the modes of change that I observe are completely inconsistent with increased radiative heating. No thanks. That’s not going to help anyone. What I observe is completely inconsistent with radiative heating by CO2. Temperature change is characterised by enormous differences according to hemisphere, latitude and time of year. Add to that the fact that the historical record indicates that temperature in a particular month in the northern hemisphere has gone through periods of increase and period of decrease that amount to decades at a time.
Read and consider carefully: http://onlinelibrary.wiley.com/doi/10.1002/cjg2.1010/abstract
LikeLike
Absolutely
LikeLike
“All data results from model extrapolations, even at 50 hPa.”
No. reanalysis is basically interpolation . The model is fitted to a grid of data and is used as kind of interpolation spline. That is a very different process to extrapolation.
If you know a physical parameter for two closely located cells on the equator you can have fairly good estimation of the cell in between. Using the same two cells to estimate the parameter at the north and south poles would be next to useless.
“The temperature increase is there at 50hPa. ”
I don’t agree at all. There is slight blip in the minimum. There is not sign of a step change which is persistent. There is a general long term rise to around 1995 then a ‘hiatus’ or even a slight down turn.
“These guys had very good data for the previous thirty years to check out relationships like the relative increase in temperature at 10hPa for a given increase at 50hPa.”
Well when I see some very good data , I may be convinced. For the moment I see model extrapolations into zones where NOAA platform says “no data available”.
Sorry to be sceptical and picky but if you are ready to believe model output without being picky and critical just believe AGW. I long ago stopped believing anything until I’ve seen the data !
LikeLike
Greg, people spend a lot of time trying to work out whether surface temperature has changed by tenths of a degree over 100 years.
In the Antarctic the change in the temperature of the atmosphere and surface pressure is measured in tens of degrees. Slight blips in the minimum? About 10°C in fact.
Interpolation….extrapolation. Get out with you. The effort to measure the temperature and the ozone content of the polar atmosphere employs ozonesondes and this has been ongoing for many years. Those sondes go up at many locations around Antarctica.
The reanalysis data is the best we have. The sources that are used to construct it are manifold. Without reanalysis our climate studies would be confined to the satellite era.
Have you ever inspected this data? http://www.cpc.ncep.noaa.gov/products/stratosphere/temperature/
LikeLike
“Slight blips in the minimum? About 10°C in fact.”
The point is, it is still a blip non a permanent step.
“Have you ever inspected this data?” I have yet to see any DATA. That;s my point.
“Without reanalysis our climate studies would be confined to the satellite era.”
Where do you get that idea. There are many datasets that are not satellite retrievals. BTW, the link you just provided starts in 1979 !
Here is some DATA. I have not analysed it. It starts too late to catch the 1979 step. Maybe that step is as a result of integrating this data !?
https://legacy.bas.ac.uk/met/data/wmc-radiosonde-export/
I’m not totally against reanalysis but I need to know what coverage it’s based on. Maybe there is some high altitude data, just NCEPs system does not include it or does not display it. Who knows?
Before jumping ahead and drawing conclusions about what is driving this or that, it is ESSENTIAL to know whether you are looking at data or someone’s understanding of what may / probably / could happen that has been built into the reananalysis model. Especially in data sparse regions like Antartica.
Otherwise you end up chasing fairies.
LikeLike
BTW, the link you just provided starts in 1979 ! My point entirely. Without reanalysis our climate studies would be confined to the satellite era. Without Kalnay’s effort we would be trying to extrapolate from the sonde record you direct me to. If I need data for the sea across a latitude band where no one goes, without reanalysis I can’t have it. It’s the only source. It comes with the sort of checks that an individual working from the sonde data simply can not provide.
DATA is what we record based on our best endeavours. At a certain altitude the sonde bursts. Based on tables the ‘observer’ records a number for ‘Total Column Ozone’. It’s an estimate. And if the sonde bursts at a low altitude that estimate can be very wide of the mark. It’s DATA nevertheless.
The reanalysis record is based on multiple checks and diverse relationships. Surface pressure varies with atmospheric temperature, Geopotential Height and the speed of the zonal wind. There is a very strong relationship between the zonal wind and the temperature of the atmospheric column. There is an inverse relationship between atmospheric pressure at the pole and in the mid latitudes. You either take advantage of the known relationships and provide best estimates or you don’t…..and in that case you don’t do climate studies. It’s simply not possible.
LikeLike
No. the part up until the balloon burst is called data, the rest is extrapolation. It is VERY important to realise the difference and not to call extrapolations data. They are not.
If not you accept that IPCC models, tuned to 1960-1990 period and extrapolated out to 2100, are reanalysis “data”, and we stop there.
I don’t know why you keep saying that there is no data before the satellite era except for reanalysis output. It is not essential to have a regular grid with data in each cell.
There are all sorts of issues with changing data coverage that need to be guarded against and as we both know there are a lot of people working on the data that are not acting in good faith.
That step in 1979 looks very interesting but it only shows at higher altitude and could simply be the result of more data being included after that date or potentially spurious extrapolation. I would not give any credence to it until I’d checked that out. Especially in data sparse regions like Antarctica and at extreme altitudes where fewer data exist.
Your article makes use of higher level data that your source no longer supports. Is that because it is no longer considered reliable ? You need to look at that.
You wish to throw into question whether the ‘consensus’ of stratosphere warming from above is correct but you are basing this on reanalysis datasets which are using models which almost certainly assume the consensus position. If you want to re-examine that, it would be better to get REAL data and work with that.
Greg.
LikeLike
RE your statement “That step in 1979 looks very interesting but it only shows at higher altitude and could simply be the result of more data being included after that date or potentially spurious extrapolation. I would not give any credence to it until I’d checked that out.”
See this https://reality348.files.wordpress.com/2016/05/25-35c2b0s.jpg?w=680 from chapter 23.
Re this comment: Your article makes use of higher level data that your source no longer supports.
No longer supports? Nonsense. See this: http://www.esrl.noaa.gov/psd/cgi-bin/data/timeseries/timeseries.pl?ntype=1&var=Air+Temperature&level=10&lat1=-70&lat2=-90&lon1=0&lon2=360&iseas=0&mon1=0&mon2=11&iarea=1&typeout=2&Submit=Create+Timeseries
There are none so blind as those who will not see.
LikeLike