Wind is air in motion flowing from areas of high to low surface pressure. Movement in the air involves the displacement of low density air by high density air. Warm air is less dense. Extreme wind speeds arise when the difference in density is greater and the contrasting air masses closer together. At the surface this manifests as closely packed isobars, lines of equal atmospheric pressure. It follows that wind speed is an indicator of the extent of the difference in density between different parcels of air. In winter cold air from the mesosphere lies on one side of the polar front and ozone rich air is adjacent giving rise to extreme winds, the polar arm of the Jet Stream.
In general, in mid latitudes wind speed increases to about nine kilometres in elevation and reduces thereafter. This is not the situation in the tropics or at the poles. Commercial airliners travel at 10-11 kilometres of elevation to reduce friction. But wind strength and direction in relatively rarefied air is still an important factor determining fuel consumption and journey times.
This fact of increasing wind speed with elevation is peculiar because we think that the air is heated by the surface of the Earth and the greatest differences in air density should manifest close to the surface of the planet. But, in the tropics the air moves sluggishly because the air tends to be uniformly warm. There is a long held notion that heating of the air in tropical latitudes drives the planetary circulation, but as we will see, that notion is incorrect.
Some winds at the surface are plainly related to differences in air density at and near the surface. These are due to heating by warm surfaces (sea breeze, land breeze, monsoons and the Trade Winds) and the release of latent heat including tropical cyclones. But winds at an elevation of 7-17 kilometres in mid to high latitudes, including ‘jet streams’, are more powerful, persistent and affect a wider sweep of latitudes across both land and sea than any wind at the surface. It is the wider variations in air density found aloft that powers these strong winds that tend to circle the planet.
It is essential to realize that the source of energy that excites ozone is primarily from the Earth itself. Ionizing short wave radiation from the sun is scarce at 9 kilometres in elevation. Wave lengths of 9-10 um (micrometres) from the Earth are plentiful and these excite ozone. The response increases as the density of the air increases. This energy is available day and night, winter and summer and from the surface to the limits of the atmosphere. In contrast short wave radiation from the sun is progressively truncated in heating the atmosphere, it heats only the upper air, more especially in summer and more especially above 10 hPa. Ninety nine percent of the atmosphere is located below the 10 hPa pressure level. Conjoint heating by long wave radiation from the Earth and short wave radiation from the sun produces a temperature peak at the 1 hPa pressure level in summer as is evident in the diagram below. For a discussion of the relative contribution of short wave and infra-red radiation to the temperature of the air according to latitude and altitude see here.

The descent of mesospheric air in winter provides a strongly variable cooling dynamic in the polar atmosphere that is unrelated to surface temperature (see above). It is apparent that the air in the Arctic at 30 hPa is cooler in winter 2015-16 than it was in 2014-15 pointing to large variations in the intake of cold ozone deficient mesospheric air from year to year.
The air at 60-90° of latitude and especially above 10 hPa is prone to sudden warmings as the vortex of cold mesospheric air is displaced off the pole or withdraws back into the mesosphere. The relative presence and the extent of the vortex is surface pressure dependent with pressure rising to its annual peak in winter due to heating of the atmosphere in the alternate summer hemisphere.
TROPOSPHERE AND STRATOSPHERE
To facilitate discussion we need definitions: It is customary to speak of a ‘troposphere’ in that region where temperature declines with increasing elevation and a stratosphere where temperature increases with extra elevation. Between these two we have a ‘tropopause’, the interval between the troposphere and the stratosphere where temperature neither increases nor decreases.
In the diagram below that relates to 30-40° south latitude, temperature declines with elevation to 100 hPa fitting our definition of troposphere. Note that the vertical axis is inverted. Rising up the axis indicates a fall in temperature. Think of it is rising into the atmosphere with the cooler air above.
There is no further decline in temperature with elevation between 100 hPa and 70 hPa and in fact the temperature traces for these two pressure levels overlap. This interval between 100 hPa and 70 hPa fits our definition of the tropopause. The vertical interval is 2 kilometres.

At the surface peak temperature occurs in January whereas in the stratosphere the peak establishes in August-September at which time ozone partial pressure reaches its annual peak. The winter maximum is an excellent demonstration of the heating power of ozone as an absorber of infra-red in the absence of short wave solar radiation. Plainly the temperature of the atmosphere that contains appreciable amounts of ozone is not driven solely by conduction of sensible heat emanating from the surface. It is driven by the ability of ozone to absorb radiation at 9-10 um. The result is a temperature peak in winter both in the stratosphere and also immediately below the tropopause. The presence of ozone is plainly apparent in the distortion of the curve at 300 hPa. The vertical interval between 100 hPa and 300 hPa spans a distance of 7 kilometres.
In addition we should note that the temperature profile in the mid latitudes is different within high and low pressure cells. The tropopause is initiated at a lower altitude in cells of lower surface pressure than in cells of higher surface pressure. This difference amounts to as much as 2 kilometres. Adding these intervals together we have 2 (the ‘tropopause’ between 100 hPa and 70 hPa) +7 (ozone affected troposphere from 300 hPa to 100 hPa.) +2 (surface pressure dependent) an interval of 11 kilometres below the ‘stratosphere’ that notionally begins at 70 hPa. Within this 11 kilometre zone below what we are calling the ‘stratosphere’ the temperature of the air and its density is to variable extent affected by the presence of ozone.
Low pressure cells have as much as 40% higher total column ozone than high pressure cells, the difference manifesting above 600 hPa. Gordon Dobson observed an average 25% decline in total column ozone between the margins of a high pressure cell and its core.
Plainly this zone where ozone affects the temperature and density of the air that is below the ‘stratosphere’ (as defined above) will exhibit large differences in air density in both the horizontal and vertical domains.
The question arises: Do the definitions of Troposphere, Tropopause and Stratosphere introduced above, assist our understanding of atmospheric dynamics or do they retard it. We have no term that applies to this ozone affected interval, 12 kilometres in vertical extent where the variable presence of ozone drives variations in air density. This is surely anomalous because these variations in density give rise to the synoptic situation at the surface. The essential properties related to the generation of strong winds relate to the presence of ozone and yet we exclude all of this zone from what what we define as ‘the stratosphere’ and we call it either ‘troposphere’ or ‘the tropopause’.
If we exclude the 7 kilometre of the upper troposphere where temperature is plainly affected by the presence of ozone then the 15 km ‘troposphere’ that notionally extended all the way to 100 hPa now ends at 600 hPa. Our troposphere is almost halved in vertical extent. Where surface pressure is low in the mid latitudes the portion of the troposphere that is unaffected by ozone is only 5 kilometres deep. In higher latitudes it is lower again. Furthermore, the ‘non stratosphere’, ozone affected portion of the column that is 12 km in vertical extent in the mid latitudes increases in depth towards the poles.
Looked at in another way the troposphere and the ozone affected ‘non stratosphere’ that we have designated as tropopause, while overlapping, together extend to an elevation of 17 kilometres that brings us to the 70 hPa pressure level incorporating 93% of the atmospheric column. But in fact the upper 15 kilometres is ozone affected comprising almost half of the weight of the entire atmospheric column.
Plainly, whatever we call it, this extensive region is set up for extreme wind velocity and it is this circumstance that drives the synoptic situation in mid to high latitudes.
There is another complication that has to be born in mind if we wish to understand atmospheric dynamics based on differences in air density. In winters the descent of mesospheric air so cools the polar atmospheric column that the point where temperature begins to ascend establishes at 30 hPa and, episodically up to 10 hPa. According to our definition the ‘troposphere’ (temperature falls with elevation) now extends to 30 hPa taking in the bulk of what we have been hitherto referring to as the ‘stratosphere’. So, according to our definitions the upper limits of the ‘troposphere’ rise up and down like a yo-yo on a string according to the strength of the mesospheric flow across the year.
Revealed is the crippling result of adhering to current thought patterns that describe the structure of the atmosphere. It is no wonder that climate science practitioners struggle to provide an explanation for the annular modes phenomenon involving shifts in atmospheric mass forced by polar cyclone activity. According to ‘climate science’ all surface weather has its origins in the ‘troposphere’ and that is taken to rule out any role for ozone in forcing density variations where the Jet Streams manifest. According to climate science heating at the equator energises the planetary winds. In fact the reverse is the case. It is the heating of the high latitude atmospheric column above 600 hPa (6 km) by ozone that forces the Jet streams and polar cyclone activity that in turn forces shifts in atmospheric mass that change the climate.

PLAIN SPEECH
Almost two thirds of the depth of the ‘non stratosphere’, from 6 km to 15 km in elevation, comprises air that is affected by the presence of ozone in sufficient amounts to affect its density. This region is where the strongest winds are to be found in the mid latitudes.
Let me reiterate the point: Due to the heating powers of ozone we have an interval from about 6 km in elevation extending upwards to the point where temperature begins to increase with elevation (17 km), and higher depending upon latitude, where the partial pressure of ozone differs between low and high pressure cells.
New definition: The weather-sphere is that part of the atmosphere where differences in air density give rise to movements of the air that we call ‘wind’ that propagate down to and affect conditions at the surface. The upper limit of the weather-sphere is found at ever higher altitudes as we approach the poles including the entirety of the stratosphere. Density differences aloft are due to variations in the partial pressure of ozone.
The so called ‘coupling of the stratosphere with the troposphere’ is now not such a mystery as it might have appeared to be. Because the ozone content of the air in the weather-sphere changes over time there is a rationale for the annular modes phenomenon described here by Wallace and here by Thompson.
The weather-sphere is neither the troposphere nor the stratosphere as traditionally defined. It manifests where there is heterogeneity in the distribution of temperature and air density in the horizontal domain. Its defining character is air moving from areas of high to low surface pressure. It manifests in mid to high latitudes determining wind direction, air temperature, cloud cover and rainfall.
So far, our reference point for this discussion has been the mid latitudes. Let’s now turn our attention to high latitudes where contrasts in air density due to differences in the ozone content of the air are more extreme than in the mid latitudes. The Polar Regions are a hotbed of activity between ozone rich and ozone poor parcels of air throughout the full extent of the atmospheric column and particularly so in winter.
THE ANTARCTIC IN MID WINTER
I focus on Antarctica, not as a parochial resident of the southern hemisphere but because I am aware that change in Antarctica is much more substantial than in the Arctic. In fact it drives climate globally as described here:
There is no easier way to appreciate the characteristics of the atmosphere than via this site: The variables of interest are surface pressure, air temperature, and wind speed. The nullschool site provides a history of the atmosphere on a three hour time schedule going back several years based on data from GFS/NCEP/US National weather service.
We examine the circulation of the air in the southern hemisphere on the 21st of June 2015. The diagram below relates to the 10 hPa (30 km) pressure level and is centred on the Antarctic. At left we have air temperature and at right the velocity of winds in the horizontal plane.

Pole-wards of 35° south latitude a wide band of very cold air rotates in a clockwise circulation at speeds between 250 and 370 km km per hour. The air is coldest above the pole at minus 84°C. It is in fact mesospheric air that descends within this vortex incorporating a flow of ozone enriched air from the stratosphere from the margins of the circulation as it does so. The result is a relatively smooth gradient in temperature falling away from the equator through to the pole. Wind velocity falls away approaching the core of the circulation. The core region of gentle descent is directly over Central Antarctica. This circulation represents the largest cell like circulation in the atmosphere. It takes the form of a massive high pressure cell that narrows in its descent, driving down temperature of the atmospheric column all the way to the surface where its distribution determines surface temperature. The air is warmer than the surface of the continent that is in darkness. At 10 hPa we see the temperature distribution below:

The relatively greater penetration of cold air above Antarctica by comparison with the Arctic is apparent. At the same time we see that there is strong variability from year to year, effectively changing the ozone content of the high latitude atmosphere. Note the warming after July in 2014 that affected both hemispheres simultaneously.
In the lower stratosphere at 70 hPa we have temperature to the left and wind to the right.
At 70 hPa the circulation is less vigorous than at 10 hPa. There is an annular ring of relatively warm air located at about 30-50° of latitude at a temperature of minus 57°C sandwiched between parcels of air that is 10°C cooler, rather less than the 15°C difference at 10 hPa. The circulation is clockwise. Wind speeds range from 100 to 130 km per hour within and without the core of cold air. Discontinuities in temperature within the rotating circulation are associated with warm air rising above inflows of cold air from the middle and low latitudes. Note that core temperature at 70 hPa is cooler than at 10 hPa reflecting a different mixing dynamic. Below we see again the relative strength of the Antarctic circulation reflected in the temperature of the air at 70 hPa and the relative coolness of temperature at low latitudes in winter by comparison with the situation at 10 hPa where warm air floods across mid and low latitudes, the result of a convective circulation that takes ozone aloft in high latitudes. At 10 hPa it circulates either towards the descending column of air over the pole or the descending columns of air in the mid latitudes.

Below we see total column ozone at left and at right a trace of ozone distribution superimposed on surface air pressure and the circulation of the air at 250 hPa. A ring of low surface pressure surrounds Antarctica made up of linked chain of intense cyclones with core central pressure of 950-960 hPa as low as in the core of a category 4 tropical cyclone but extending over the entire latitude band from about 50-70° south latitude.
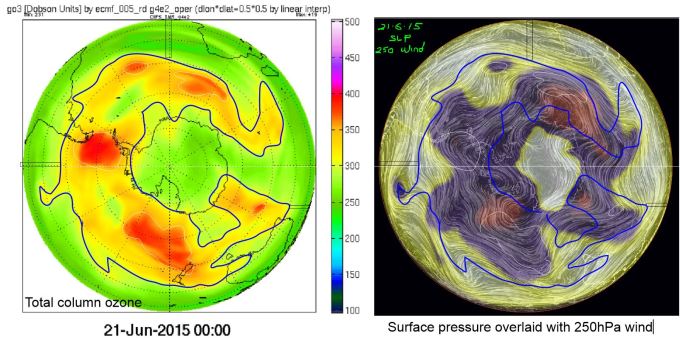
There is a loose correspondence between ozone and surface pressure. This is to be expected because air masses rotate at different speeds at different elevations within the column. On the margins of the ozone rich air the pattern of movement of the air closely corresponds with the pattern in the distribution of ozone. The 250 hPa pressure level may be close to the elevation where the greatest differences in air density manifest in mid latitudes but if wind speed is our proxy then the 10 hPa level is where the greatest density differences manifest.
Below, is shown the temperature and the circulation of the air at 250hPa

At 250 hPa the descending air in the core over Antarctica is 15° C warmer than at 70 hPa. This is evidence of mixing with warmer air from the periphery as the air descends. On the margins of the coldest air there is warmer air at -49°C a difference of 20°C. The warmer air on the margins of the core ascends to provide the well resolved warm ring of ascending air that we saw at 70 hPa and with a greatly expanded circumference at 10 hPa. The coldest air at 250 hPa extends well beyond the margins of the Antarctic continent and over the relatively warm sea. The warmest air at 250 hPa and at 70 hPa is found above the ocean on the margins of the continent.
Jet streams moving at between 150 km/hour and 300 km/hour lie on the inner and outer margins of the annular ring of relatively warm air that ascends in a clockwise spiral of intense activity. It is the existence of this annular ring of warm air that gives rise to and defines the character and intensity of polar cyclones. The result is a marked deficit in surface pressure at 60-70° south latitude that persists year in and year out but changes in its intensity on centennial time scales. It is this ring of cyclones that governs the anomalous shifts in atmospheric mass responsible for change in the planetary winds and surface temperature.

Examining the temperature profile at 250 hPa in more detail we see warm air rising above cold air. The cold air dives under the warmer air that initiates the development of polar cyclones. Thus polar cyclones have warm air at their hearts, initiating uplift. The circulation of the air about the centres of lowest surface pressure reflects the pattern of movement in the warm air component of the circulation.
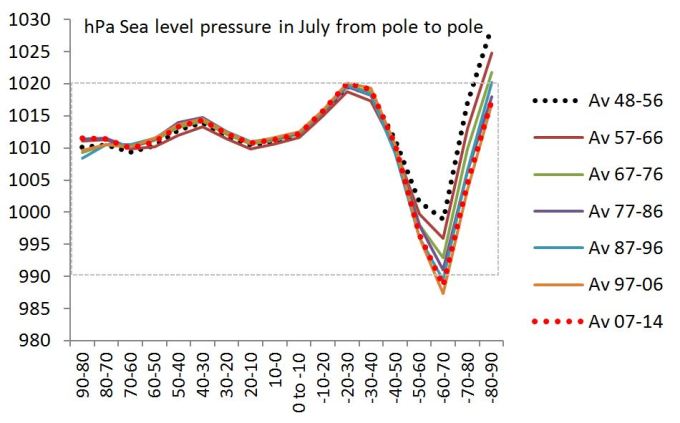
The diagram below is evidence of the strength of the ozone driven circulation on the margins of Antarctica. The loss of surface pressure at 60-70° south between 1948 and 2014 is due to an increase in the partial pressure of ozone in the atmosphere over that time interval.

At 500 hPa (above) the thermal character of the atmosphere is defined by its circulation with polar cyclones manifesting on the perimeter of the zone of colder air that has the same morphology as it exhibits at 250 hPa . At the perimeter of the cold air there is a belt of strong winds associated with the margins of the polar vortex aloft. This is the manifestation of the polar front Jet Stream. At 500 hPa there is little evidence of the weaker subtropical arm of the jet stream.

At 850 hPa (1 km) the morphology of the jet stream is reflected in the strong winds associated with individual polar cyclones but the winds are muted in comparison with those at higher elevation. The forces that generate this pattern at the surface manifest at altitude between 250 hPa and 10 hPa in response to the distribution of ozone in the atmosphere.
THE JET STREAMS
The Jet streams have two sources. One arm manifests near the pole and the other in the subtropics. Near the pole in winter the entire zone from 500 hPa through to the top of the atmospheric column is involved with the strongest winds of up to 450 km/hour at 10 hPa in spring time. In Australia it is recognised that September-October brings gale force winds. It is at this time that the partial pressure of ozone on the margins of Antarctica peaks and the ozone hole manifests providing the steepest contrast in air density.
The defining characteristic of the strongest jets streams is a marked difference in air density between cold ozone deficient air that descends from the mesosphere (-80°C at 70 hPa and -67°C at 250hpa) and ozone rich air on the equatorial side of the polar front that may be 40°C warmer. We habitually measure wind strength in terms of the horizontal. The core of the independent low pressure cells within the circulation at 250 hPa (ascending air) is much more extensive than a tropical cyclone. The energy to create the circulation is provided by the Earth itself per medium of ozone. From 250 hPa upwards the circulation resolves into a single stream of air circulating on the margins of cold mesospheric air and ascending as it does so. Geostrophic balance is preserved by descent over the pole and in the mid latitudes, the latter implying a cloud cover vacillation. In this way ozone is recycled at elevation between high and mid latitudes and returned to high latitudes by the near surface westerlies.
The subtropical jets are on the margin of ozone deficient air of tropical origin and ozone rich air from higher latitudes. The jets manifest between cells of low and high pressure air. It is plain that the weather-sphere is not co-extensive with the troposphere. At the Antarctic pole it can not be described without reference to the entire atmospheric column.
The simplest and most vigorous pattern of surface pressure generated by this circulation is in the southern hemisphere.
The jets strengthen in winter as ozone partial pressure builds. It builds as low sun angle reduces the photolysis of ozone by short wave radiation allowing ozone to proliferate. Additionally, the uplift of erosive NOx and water vapour from the lower atmosphere is less of a feature of the atmosphere in high latitudes than in low latitudes.
Gordon Dobson observed that Total Column ozone maps surface pressure with more ozone in low than high pressure cells. Paradoxically, low pressure cells form at 60-70° of latitude where the surface air is extremely cold and dense. High pressure cells occur within the mesospheric air over the Antarctic continent and also in low latitudes where the near surface air is warm and of low density. It is the difference in the ozone content of the air in the weather-sphere that determines surface pressure, not the character of the air near the surface.
THE SYNOPTIC SITUATION AT THE SURFACE
It is important to realize that the synoptic situation that we chart as surface pressure is generated where differences in air density are most extreme and the wind is accordingly much stronger than at the surface.
In a tropical cyclone that is driven by release of latent heat the phenomenon is generated at the surface and peters out below 500 hPa. But, if a tropical cyclone travels into the mid latitudes it can find an ally in the cyclones of polar origin. However, most tropical cyclones lose intensity as they exit the warm waters of the tropics, especially if they cross onto the land. The power and extensiveness of a polar cyclone dwarfs that of a tropical cyclone. Whereas the tropical cyclone is generated at and near the surface the polar cyclone is generated aloft.
CLIMATE CHANGE
Climate change is due to a systematic change in the synoptic situation due to change in the ozone content of the weather-sphere. It manifests as shifts in atmospheric mass, a change in the origin of the wind and associated changes in cloud cover. Change manifests most obviously as volatility in surface temperature in January (the Arctic winter) and July (the Antarctic winter). The Antarctic drives the long swell of change with an interval of perhaps 100 years, but only in the context of recent experience, while the Arctic delivers the surface chop over the bulk of the planet northwards of 30° south latitude.
Because climate change manifests quite differently in each hemisphere and is most severe in the winter season a global temperature statistic averaged across the year, like any average, but much worse in this case, conceals the dynamic behind the change in surface temperature. The average global temperature can not reflect the dynamic that is responsible for climate change. To see that dynamic in its full majesty we need to look at the atmosphere in high latitudes in the winter season and in particular, the atmosphere over the Antarctic continent.

“Climate change is due to a systematic change in the synoptic situation due to change in the ozone content of the weather-sphere. It manifests as shifts in atmospheric mass, a change in the origin of the wind and associated changes in cloud cover.”
This is a fundamentally different conception of the underlying drivers of “climate change”. In this world view I take it that if there is an identifyable “cause” then unltimately it is whatever drives the content and distribution of ozone. It would not appear to be CO2 that drives change in atmospheric ozone content. I presume you will be discussing origin of systematic changes in ozone content in another posting?
LikeLike
Rob R.
You are right. I am talking of the natural modes of climate change.
You have missed some chapters. Perhaps 16-20.
In brief the ozone content of the atmosphere depends upon the rate of flow of ozone deficient mesospheric air into the stratosphere over Antarctica that is ultimately dependent on solar activity. That air leaks past the so called vortex as if it were a sieve. Accordingly, the generally ozone deficient nature of the southern hemisphere.
A paper from January of 2016 establishes the point that the rate of flow of mesospheric air depends on the solar wind via the electromagnetic nature of the atmosphere. http://onlinelibrary.wiley.com/wol1/doi/10.1002/2015JA022104/full
Its worth the $6 to get behind the pay wall.
U refers to the zonal wind, an index of the rate of flow inside the polar vortex.
The authors have no idea of the mechanism involved. That’s where I come in.
LikeLike
So, it looks like you have identified a prime candidate for the mysterious “force X” that has been postulated by David Evans. He has a long series of postings on Jo Nova’s website in which he discusses the evidence for a non-earth-bound (solar) driver for change in the global average atmospheric temperature. To me it seems like your project complements his rather nicely. Like the left and right hands of the same phenomenon.
LikeLike
Hi Rob,
I haven’t followed David Evans work so I cant comment. But I am quite certain that what I describe here is real. I am not making it up as I go along. The critical pieces fell into place about 8 months ago. The manner in which the poles interact is very interesting and yet to be explained. If Wallace had realized that it is ozone that is responsible for the synoptic situation and a major driver of cloud cover he would have tumbled to this 20 years ago.
It is profoundly disabling to postulate that CO2 is driving a temperature increase.
One has to start with an observation of the manner of the warming and the manner of the change in the synoptic situation over time.
LikeLike
Erl,
You are presenting an impressive body of work. It is very informative. I suspect that to get the traction it deserves you will need to give much shorter synopsis so that readers don’t get lost in the detail, or can at least refer to it (the synopsis) to see quickly how what they are reading at any particular moment actually fits into the overall picture. That tends to be my problem- basically its information overload without a really good context to fit the new data around. You are trying to reconceptualise almost the entire science of climate-change after all.
Rob.
LikeLike
Rob, I hear what you say. The blog format is not conducive to setting out the argument. With book in hand, table of contents in the front and index at the back….accessing things by flicking over pages there is a real advantage. I must confess to not always sticking to the plan. Sequence is sometimes a concern. The blog takes you straight to the later stages of the detailed exposition without the advantage of the preparatory chapters.
Another problem arises when I try to be exhaustive in dealing with the subject and following a train of thought. Posts that are too long. Its written from the point of trying to be complete rather than to be entertaining.
And its a big subject.
Meanwhile, if there are questions that occur to you please ask them. Interaction and discussion helps to locate those parts that need better explanation than I provide in the text….and points of difference can be located together with any errors in fact or disagreements about cause and effect.
Some of the chapters to come will help to bring things together. In particular chapters on the planetary winds.
But, unlike a book that is written for a final presentation its all done on the hop without second party proof reading or suggestions as to how best to get from a to b. A manuscript in progress.
LikeLike
Erl, I know what its like being in inside seemingly modest projects that snowball and grow almost uncontrolably in several different unexpected directions. Keep up the good work.
LikeLike
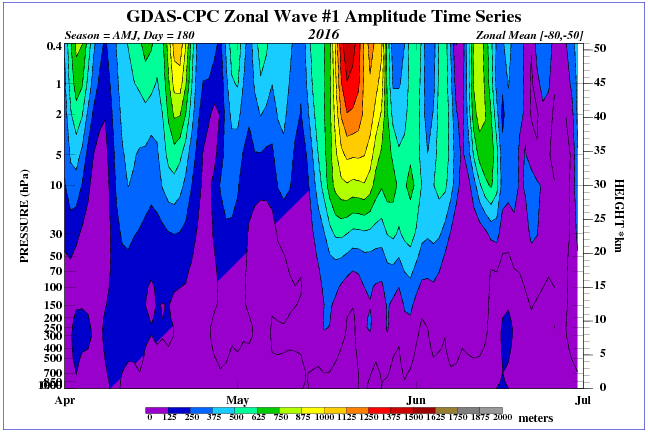
Another wave in the stratosphere.
LikeLike
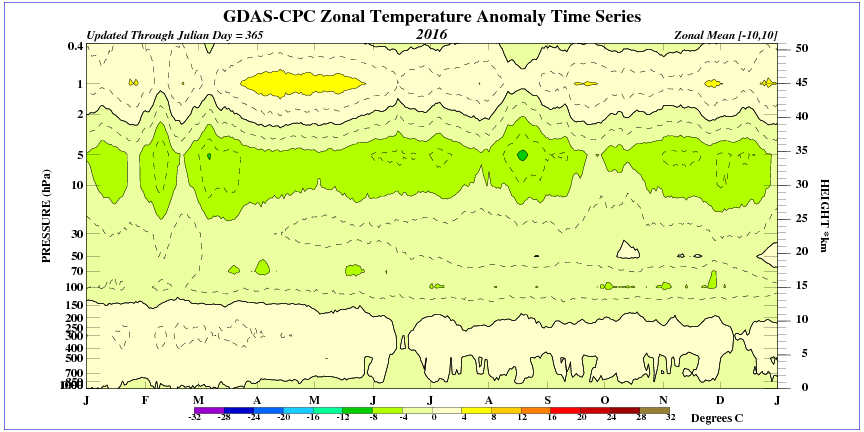
Temperature above the polar circle low. Similarly above the equator. Falls UV radiation.

LikeLike
Erl


LikeLike
Ren, What causes the superrotation of the upper atmosphere in winter and spring? As I see it, as the upper atmosphere over the Antarctic pole cools the zonal wind speed increases. Anomalous cooling speeds it further.
Not only does this happen in the upper atmosphere but also between 300hpa and 100hPa as seen here: http://www.cpc.ncep.noaa.gov/products/stratosphere/strat-trop/gif_files/time_pres_UGRD_MEAN_ALL_SH_2016.png
LikeLike
I do not know. It is certainly associated with a decrease in temperature over the polar circle and the a change in ownership of gas.
https://en.wikipedia.org/wiki/Molar_volume
Animation from http://earth.nullschool.net – windspeed at 10 hPa (about ~26500m / ~87000 feet above sea level).
LikeLike