
Source of data here.
BACKGROUND
Ozone is a greenhouse gas that absorbs radiant energy from the Earth at 9-10 um heating the air. It accumulates in the winter hemisphere but not over the polar cap. The descent of very cold, dense, ozone deficient air from the mesosphere is promoted by increased surface pressure over the polar cap. The resulting difference in air density either side of about 60-70° of latitude is responsible for the formation of polar cyclones where differences in air density between 300 hPa and 50 hPa create upper level troughs that propagate to the surface.
The term NOx refers to the mono nitrogen compounds of nitrogen, NO and NO2. NOx is abundant in the troposphere and less so in the mesosphere. NOx catalytically destroys ozone.
The depression in surface pressure on the margins of Antarctica in October as documented above (rather than in December or January when the atmosphere is warmest) is related to the establishment of the aforementioned difference in atmospheric density across the polar vortex and the consequent generation of intense polar cyclones.
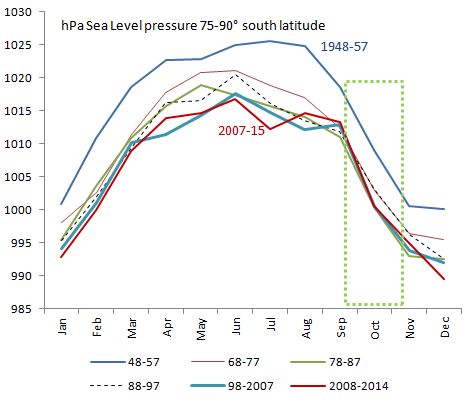
The more severe is polar cyclone activity, the more surface pressure falls away over all latitude bands south of 50° south latitude. The diagram above displays the evolving decline in surface pressure over the last seven decades.
The diagram above and another immediately below represent unacknowledged ‘smoking guns’ of natural rather than man made climate change. If we acknowledge the natural influence there is no need for other arguments to explain the change in climate that has occurred.
Strong winds (jet streams) are found at the 200 hPa level, much stronger than at the surface. The relatively abrupt increase in the temperature of the air at 200 hPa in the southern hemisphere that occurred in the late 1970’s changed the parameters of the climate system. Some have described the accompanying 1°C increase in tropical sea surface temperature as a manifestation of the Great Climate Shift of 1976-78.

This chapter explores the origin of the Antarctic ‘ozone hole’ finding that it is entirely natural in origin.
THE HOW AND WHY
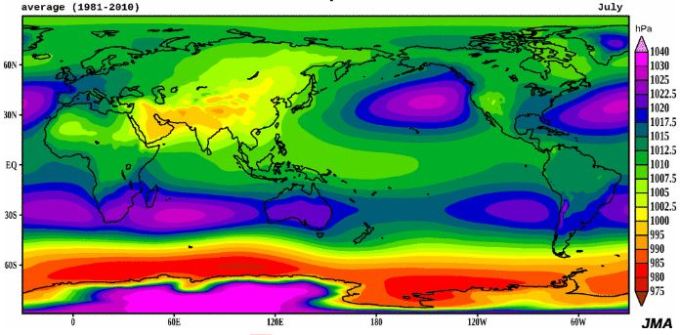
On the margins of Antarctica we have a very special place where extremely low surface pressure manifests all year round. Even in July when surface pressure peaks strongly over the Antarctic continent there is anomalously low surface pressure on the margins of Antarctica. This is the part of the globe where surface pressure is regularly less than anywhere else, including the massive Eurasian continent in the height of summer. The force that is responsible for this pressure deficit is unknown to climate science. It is the lack of knowledge of the forces involved that has enabled the ‘ozone hole’scare to to be perpetuated. The horse of ‘ozone deficit’ has been harnessed to the global warming cart in an effort to implicate man when both phenomena are actually the result of natural processes that have their origin in the distribution of land and sea.
Climate science has no explanation for the existence of the massive deficit in atmospheric mass on the margins of Antarctica (fewer molecules in the atmospheric column) let alone an explanation for the decline in surface pressure over the last seventy years. The gradual loss of atmospheric mass points to an increasing differential in air density within and without the polar vortex driven by ozone heating of the atmosphere outside the vortex and ozone depletion within it. We can infer from the surface pressure data that the ozone hole has intensified over the decades. We can also see that the existence of the hole pre-dated the manufacture and widespread use of those compounds that have been restricted under the Montreal protocol designed to ‘save the ozone layer’. This protocol was the first major triumph of the environmental movement that laid the groundwork for the United Nations to explore the supposed warming effect of carbon dioxide in the atmosphere, a warming effect that has yet to be demonstrated to the satisfaction of those whose field of expertise is atmospheric physics. So effective has the agitation of the environmental movement been that advanced western nations have, regardless of consequences, fallen in love with the idea of utilizing the energy from the sun and the wind while capturing carbon dioxide from the atmosphere and burying it in reservoirs underground. Don Quixote rides again but he rides through a greener countryside due to the response of plants to the easing of a carbon dioxide deficit. To a photosynthesising plant 400 ppm of carbon dioxide in the air represents near starvation. As the CO2 content of the air has increased all CO2 using organisms have responded magnificently.
Back in 1948-56 the ozone hole was severe in November. Today it is severe in October. That is what the first graph above tells us. It tells us also that surface pressure in high latitudes has declined over time. We need to understand the sources of the extra ozone that has given rise to that increasing deficit in atmospheric mass, increased the vorticity of polar cyclones on the margins of Antarctica, enhanced the velocity of the westerly winds that drive southwards from the mid latitudes and produced the marked rise in the temperature of the air at 200 hPa between 1976-8 in the mid altitudes of the southern hemisphere.
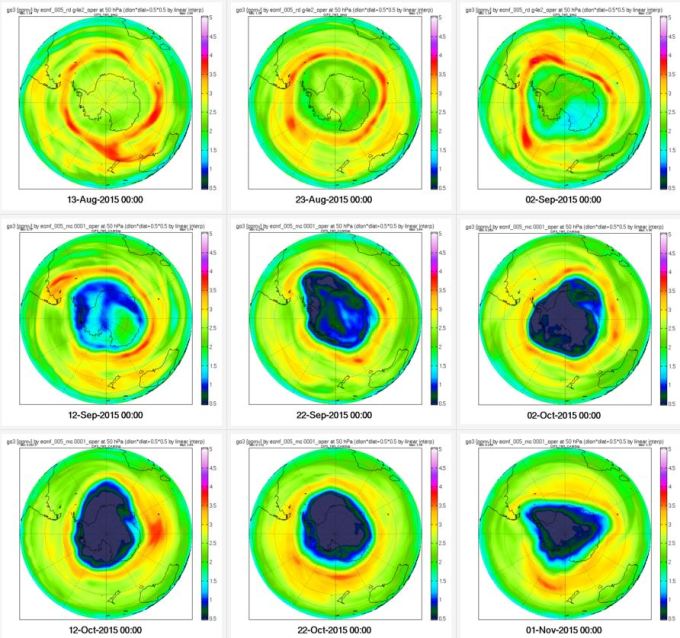
THE EVOLUTION OF THE DISTRIBUTION OF OZONE AT THE 50 hPa PRESSURE LEVEL IN 2015

The last chapter explored the structure of the atmosphere on 20th August 2015 by way of introduction to this discussion.
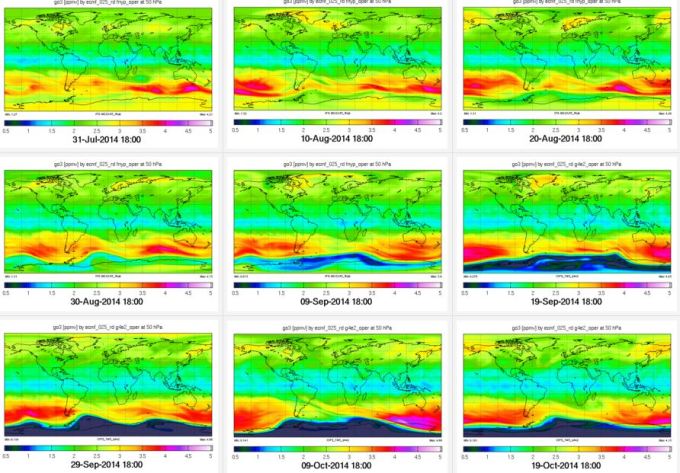
As can be see via inspection of the diagrams immediately above, the slowly developing ‘hole’ of ozone deficient air at 50 hPa first becomes evident after 30th July. The slight green tracer increased in latitudinal thickness over the month of August at about latitude 60° south. By 9th September it manifests as a dark blue zone of fully depleted ozone on the margins of the Antarctic continent. The zone of depletion grows to occupy the entire Antarctic continent from 19th September through to the 8th November.

Inspecting the diagram above we see that temperature of the air at 50 hPa on September 19th is in excess of the of the -77°C necessary for the functioning of the chlorine chemistry that works in conjunction with polar stratospheric cloud to destroy ozone. At this time of the year the temperature at 50 hPa is not only too warm for chlorine chemistry but it is warming fast and not looking back. This occurs as the very cold ozone deficient air inside the vortex is withdrawing back into the mesosphere from whence it came. It is being replaced by air from the lower stratosphere, below 50 hPa.
We notice that the hole first manifests not at the core over the pole where temperature is coolest but on the margins of the polar circulation where the temperature is warmest and grows by extension from that outer margin. This too, is inconsistent with chlorine chemistry.
As we see below surface atmospheric pressure falls steeply between 75°and 90° south latitude as the ozone hole is established in the period from 19th September through to the 8th of November.
The steep reduction in Antarctic surface pressure that begins in mid September is a result of two influences. Firstly there is cooling in the northern hemisphere allowing a shift of atmospheric mass back across the equator. Secondly, there is the fall in surface pressure associated with the development of the hole. The hole exaggerates the difference in the temperature and the density of the air between the polar cap over Antarctica on the one hand and the air over the Southern Ocean that is ozone rich on the other. The density gradient that drives polar cyclone generation is enhanced as the ozone hole builds.
In order to track the distribution of ozone on 20th August as the ozone hole begins to develop, I refer the reader to the detailed diagrams immediately below. The view is polar stereographic with Antarctica at the centre and South America at 10 O’Clock. I suggest the reader begins with a close inspection of the data at top left and moves about in a clockwise fashion.
Source of this data here

In the core of the circulation the air is relatively deficient in ozone (top left) and relatively dry (top right). The inner core of the circulation is also free of NOx (bottom right). The core is occupied by dry mesospheric air that descends in the winter season as surface pressure increases to a planetary maximum over the Antarctic land mass.
Below is the situation in terms of pressure relations. The depth of the pressure deficit at 60-70° south is a product of polar cyclone activity. This pressure deficit is the direct product of local differences in air density.
Look again at the set of 4 diagrams above. At 50 hPa (top left) peak ozone manifests in a narrow, unbroken ring like band with a diminished diameter by comparison with total column ozone (bottom left). Look carefully to see the distribution of NOx derived from the diagram bottom right that is co-extensive with the zone of low temperature at 70 hPa (bottom left).
Observe the erosion of the ozone content of the air inside the margins of the annular ring of highest ozone concentration in the diagram top left. This erosion is a product of the joint activity of water, in which ozone is soluble and NOx that chemically destroys ozone as it is drawn into the heart of the polar cyclones that surround the continent(see below).

Look carefully at the diagram bottom right in the set of 4 diagrams above. At 50 hPa NOx is plainly drawn into the upwardly ascending circulation inside the zone of peak ozone concentration at 50 hPa. The distribution of NOx is almost co-extensive with the zone of very low surface pressure seen immediately above and it lies across and inside the cordon of air that is rich in ozone. This mixture of air from the mesosphere and the weather-sphere ascends in the core of polar cyclones and presents as a near laminar flow at 70 hPa. It will continue to ascend to the uppermost parts of the atmospheric column at 10 hPa (30 km, 99% of atmospheric mass below) and beyond. By the end of October the air at 1 hPa will attain a temperature of 0°C being 5°C warmer than the air over the equator and 25°C warmer than the air over the Arctic at this same level. This occurs at a time when the sun has just appeared over the horizon. The warmth of the air is due primarily to the absorption of long wave radiation from the Earth by ozone that is transported aloft by this circulation.
We can now transfer our attention to the diagrams below. In the initial stages of the development of the ozone hole the zone of high surface pressure across the continent maintains a slightly enhanced ozone concentration (yellow tones) by comparison with the perimeter of the continent where green tones prevail. But, look at what happens as surface pressure falls and the temperature of the air across the polar cap rapidly increases:
Compare the distribution of NOx (below) to the distribution of ozone within the ‘hole’ shown above. There is plainly a very close identity in terms of the spatial arrangement. The cause of this ‘ozone hole’ phenomenon is plain to see.
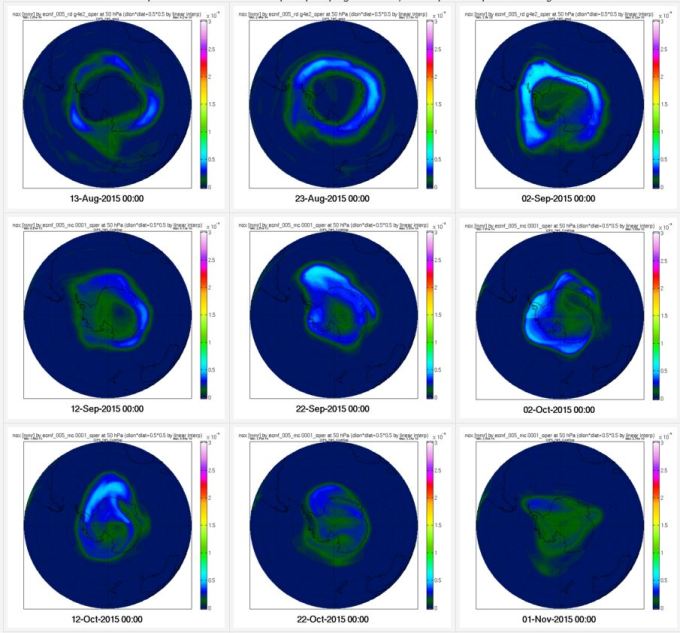
NOx migrates into the core of the circulation depleting its ozone content from the margins of Antarctica where it is entrained with ozone. This NOx charged air gradually occupies the entire space over the continent that formerly exhibited high surface pressure, extreme cold and a very dry atmosphere with some ozone. This is the process that erodes ozone to produce the ‘ozone hole’. It proceeds by gradual replacement of one sort of air with another, the latter including a compound, namely NOx, that soaks up ozone. It closes from the perimeter like the iris in the aperture of a camera.
Plainly NOx rich air is progressively entrained into the core of the circulation over the continent as mesospheric air stalls in its descent. NOx rich air from below 50 hPa accumulates in the lower stratosphere as the formerly descending circulation withdraws. The hole is a function of atmospheric dynamics that are initiated in August on the margin of the ‘night zone’. It is unrelated to the incidence of solar radiation or the return of sunlight and any possible involvement with stratospheric clouds and chlorine chemistry. NOx destroys ozone in the Antarctic atmosphere as efficiently as it destroys ozone in near equatorial latitudes.
There is no correlation between the amount of ozone within the core and that without. In other words ozone levels in the wider stratosphere remain high as ozone levels plummet within the localized ‘hole’. This is inconsistent with the ozone hole narrative beloved by those who maintain that the activities of man are endangering the global stratosphere.
The diagrams below trace the gradual disappearance of NOx and its replacement with relatively ozone enriched air. This is made possible by the ingress of air from the perimeter (contraction of the vortex structure) and the chemical exhaustion of NOx. Rather than being confined to the perimeter of the continent as it is in winter, ozone rich air floods over the whole, occupying the entire continent by December 31st when temperature at 50 hPa reaches its annual maximum. (see the fifth diagram in this chapter).

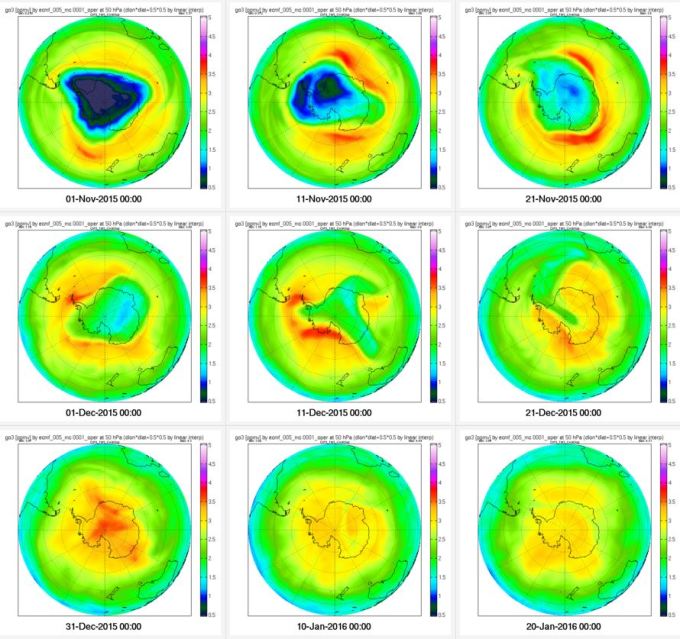
As NOx inside the hole disappears, so too does the ozone hole. The resultant warming of the lower stratosphere at 50 hPa marks the transition to the ‘final warming’ over the polar cap and the change from descent in the core to gentle ascent with an accompanying 180° swing in the direction of the wind at 10 hPa. The evolution of the winds and the temperature of the air is shown below.
EVOLUTION OF THE WINDS AT 10 hPa
The diagram below shows the temperature of the air at 10 hPa and the direction of the wind on 13th August as the hole begins to manifest. Data from here.
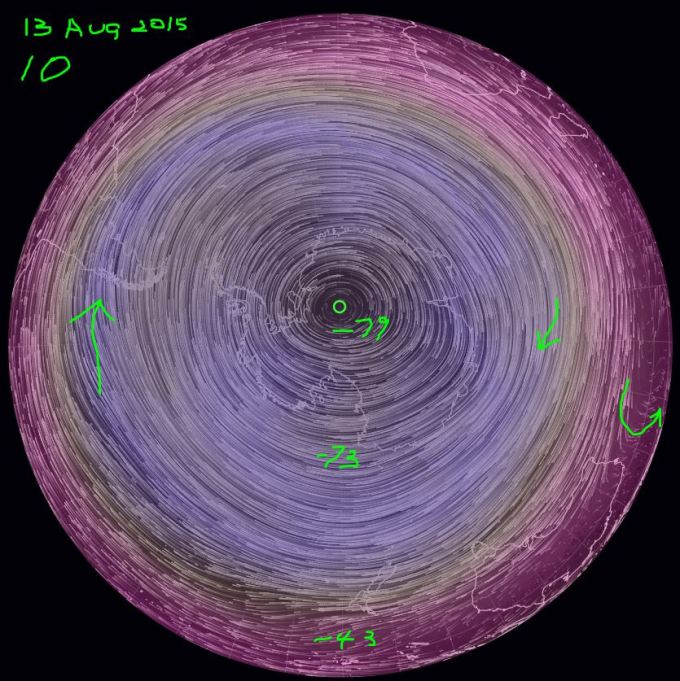
On 13th August (above) there is a vigorous clockwise circulation of very cold mesospheric air directly over the Antarctic continent. Cold mesospheric air extends as far north as 30° south latitude. North of 30° south latitude the air circulates in an anticlockwise direction.

By 4th December (above) the vortex of mesospheric air is much reduced in its latitudinal spread and 65°C warmer. The zone of air that rotates in an anticlockwise direction has expanded and the internal core that rotates clockwise has contracted.

By 22nd December (above) as the last vestiges of the ozone hole disappear into the wider atmosphere, the air at 10 hPa has reversed in its direction of flow and is now circulating in an anticlockwise direction. This will persist until the resumption in the intake of mesospheric air as surface pressure over Antarctica begins to build in February.
This is the same process that is responsible for stratospheric warmings in winter except that the winter warming may involve the displacement of the vortex off the polar cap, particularly so in the northern hemisphere. Displacement is extremely rare in the southern hemisphere where the vortex is firmly anchored over the Antarctic continent. The degree of anchoring and the appearance of the ‘ozone hole’ is a function of the distribution of land and sea. The sea supports the development of low pressure (ozone rich) zones in winter and the land supports the development of high pressure zones (rich in dry, relatively ozone deficient mesospheric air). Unlike the southern hemisphere there is no facilitating land mass within the Arctic Circle. Rather there is land in Eastern Eurasia and across northern Canada and Greenland. The increase of atmospheric pressure in the northern hemisphere in winter tends to occur over the land masses rather than over the Arctic Ocean.
Accordingly, the synoptic situation in the northern hemisphere is always more complex and less stable.
The relative ozone poverty of the entire southern hemisphere is a product of the strength of the mesospheric flow and the constant escape of this air into the wider atmosphere. The so called ‘vortex’ is actually a chain of polar cyclones that might be compared to a chain of egg beaters with their mixing heads set at between 300 hPa and 50 hPa in elevation at an altitude where ozone, and the density of the air is most variable. Accordingly, there is a great deal of horizontal movement and vigorous mixing at this elevation. Egg beaters mix and so too do this chain of polar cyclones.
The notion of a so called containing ‘strong vortex’ that acts as some sort of wall separating relatively dry cold mesospheric air from ozone rich air on the periphery is nonsense. If the chain of cyclones intensifies, a wave in the chain develops or a major cyclone breaks free of the chain then cold air traverses lower latitudes. The notion of containment is un-physical.
The notion of planetary waves that supposedly govern the temperature of the polar cap at higher elevations may be likened to the suggestion that the tail wags the dog rather than the other way round. The area of high surface pressure inside a ring of polar cyclones that supports a descending vortex simply expands and contracts according to the flux in surface pressure over the Antarctic continent. When I pass my hand across the surface of a pond is the depression of the water level behind my hand responsible for the movement of my hand?
Some commentators will suggest that the ozone hole is a natural feature of the Antarctic circulation and may be of the opinion that it has been aggravated by chlorine chemistry. This argument ignores the introduction of NOx to the circulation in the lower stratosphere and the disappearance of the zone of higher surface pressure across the continent enabling the ring of polar cyclones to close in as the circulation over the polar cap responds to reduced surface pressure.
The increase in the contrast in ozone partial pressure as a consequence of the ‘hole’ assists to lower surface pressure across the polar domain in October because it intensifies polar cyclone activity.
The increase in the ozone content of the polar stratosphere on the equatorial side of the low pressure zone as a consequence of the reduced flow of air from the mesosphere acts to strengthen polar cyclone activity, directly reducing surface pressure across the entire domain further weakening the flow of mesospheric air that modulates ozone partial pressure. This represents a strong feedback mechanism that promotes the relatively sudden appearance of the ‘ozone hole’.
There is no response in the wider atmosphere to ozone deletion within the hole.
The temperature of the air is too warm for chlorine chemistry prior to and at the time when the hole reaches its greatest extent.

In evaluating the argument for aggravation of the hole due to chlorine chemistry we need to be mindful of certain things:
- The increase in the temperature of the stratosphere over Antarctica over the period of record since 1948 indicates a diminution in the flow of mesospheric air into the wider atmosphere allowing ozone partial pressure to build. The resulting increase in temperature is most marked in October as we see in the diagram immediately above. This is a function of ozone enhancement in the atmosphere outside the ‘hole’ and ozone depletion within, that acts to reduce surface pressure.
- If chlorine chemistry were the cause of a hole then it should be reflected in an erosion of ozone and a fall in the temperature of the Antarctic stratosphere generally, both within and without the hole. The reverse is in fact the case.
- The increase in temperature wrought by ozone increases the vorticity of polar cyclones and the rate of influx of NOx into the lower stratosphere over the polar cap as the hole develops. NOx enters in the horizontal rather than the vertical domain. and therefore the hole manifests in the lower stratosphere.
- The reduced surface pressure in high latitudes in October has the effect of stalling the rate of infusion of mesospheric air in late spring, bringing on an earlier and longer lasting ‘final warming’ involving an earlier and more emphatic choking of the winter circulation. The result is an enhanced presence for NOx in the lower stratosphere and enhanced convection involving a direct enhancement of the ozone deficient ‘hole’ and a marked warming of the upper stratosphere in October as the hole manifests. It is the warming in October that has been the most noticeable change in the southern stratosphere since 1976.
- Finally, we can note that in terms of inter annual and inter-decadal temperature variability at 10 hPa, from latitude 50° south to the Antarctic pole it is the months of September and October that stand out as extreme. The graph below documents this point.
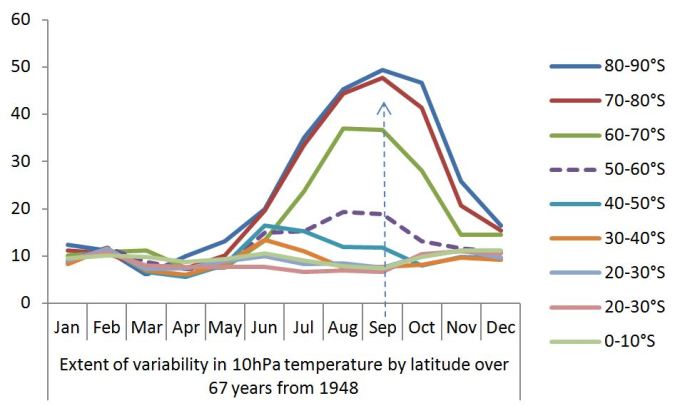
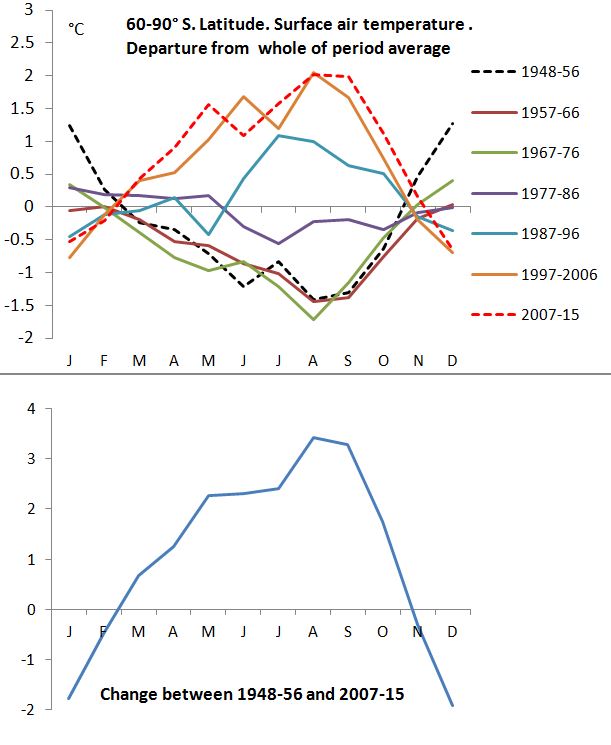
Climate variability at any point on the Earth’s surface has two origins. It proceeds via the alteration of the partial pressure of ozone via the descent of mesospheric air either in the Antarctic or the Arctic. The effect of Arctic processes is felt in the Antarctic between November and May (see below). It is in the winter season that polar atmospheric processes drive change. Accordingly variation in surface air temperature is most extreme in winter. The diagram below confirms that point so far as the Antarctic is concerned.
POLITICS, ECONOMICS AND GOVERNMENT
These observations undermine the rationale for the Montreal protocol that involved the limitation of the emissions of certain chemicals supposedly harmful to the ‘ozone layer’. That protocol represents an error of judgement based on the desire of ‘environmental activists’ to influence public policy. The enthusiasts who promoted this story were and continue to be responsible for a costly distraction. The inconvenience and waste that has been involved in the implementation of this protocol is regrettable. The most grievously affected should sue the proponents of the Montreal Protocol and their supporters in government that continue to promote this argument. A vigorous pursuit of those involved is desirable in order to secure a more circumspect expression of opinion by elements of society hell-bent on promoting the notion that catastrophe of one sort or another is about to engulf mankind. The catastrophe in this case is but a figment of their enthusiastic, no doubt well meaning but ultimately deluded imaginations. These people are in fact ‘the catastrophe’. They should be forced to bear responsibility for their advocacy. They have injured society that trusted their expertise as ‘scientists’. The injury is related to both the material and the intellectual well being of humanity and its notions of self worth. The effect has been wholly pernicious.
WHY HAS THIS CHANGE IN THE ATMOSPHERE OCCURRED BRINGING WITH IT AN INCREASE IN THE OZONE CONTENT OF THE AIR?
The strength of the ‘zonal wind’ that circulates at 50-90° south latitude is related to geomagnetic activity as a product of the Earth’s electromagnetic environment and its response to the solar wind. The abstract reproduced below appeared on-line in January 2016. It points to a solar influence on the circulation of the air in high latitudes. It is the latest of many papers that have appeared over the last thirty of forty years that point to the same mode of causation, all studiously ignored by those who write UNIPPC reports. The UN and the EEC have assiduously promoted the story of catastrophic global warming. The UNIPCC analysis is pursued in ignorance of the change in the parameters of the climate system set in high southern latitudes that condition the planetary winds, cloud cover and surface temperature. The promotion of the idea of ‘anthropogenic climate change’ has been pursued despite the manifest inability of climate models to predict the course of global temperature over the last 18 years. It is time to say, enough is enough, to become a little more analytical and for common sense to prevail.

A collapse in the zonal wind represents a reduction in the flow of air from the mesosphere into the polar atmosphere. It results in an increase in the ozone content of the atmospheric column impacting surface pressure, the distribution of atmospheric mass and the planetary winds.
Let’s be quite plain. Here we are referring to the agent of change in the daily synoptic situation and climate in all parts of the globe on all time scales.
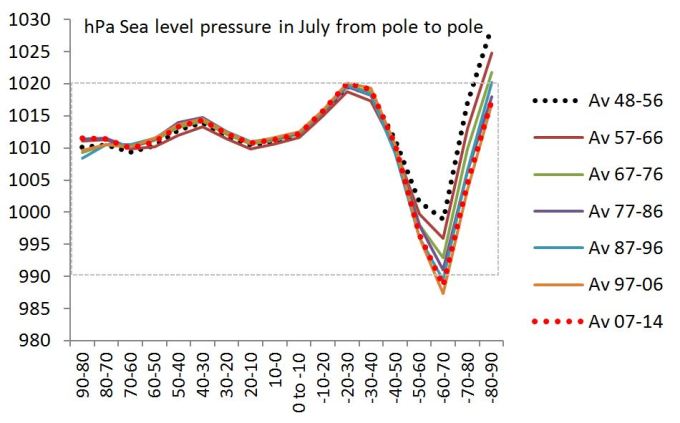
Climate is driven by two influences, one stronger than the other, one operating in the middle of the year (Antarctica) and one at and about its commencement (the Arctic). These influences yield a tell-tale variation in the temperature of the air according to latitude as documented here.

Reblogged this on Tallbloke's Talkshop and commented:
.
.
Erl Happ looks at Solar-Geomagnetic effects on ozone and weather.
LikeLike
From April you can see a fairly clearly waves of cosmic radiation. GCR periodically high.

LikeLike
What sort of periodicity can be obtained from that chart?
LikeLike
From Tallbloke:
Richard111 says: May 14, 2016 at 7:26 am
(“And again this layman gets lost.
“Ozone is a greenhouse gas that absorbs radiant energy from the Earth at 9-10 um heating the air.”
I can accept this claim for when the sun is below the horizon as this fits slap in the “window”, but what is the effect when the sun is up? I understand ozone is created by UV sunlight. UV sunlight has a marked effect on ocean warming. Have the energy exchange levels been worked out to confirm ozone is a “greenhouse gas” and NOT A COOLANT?”)
erl happ says: May 14, 2016 at 7:37 am
Richard, Before you spout again in such disparaging terms I would ask you to consider this:
Richard111 Asks most politely, “if the -energy exchange levels been worked out to confirm ozone is a “greenhouse gas” and NOT A COOLANT?”
The ERL HAPP declares that a politely poised question for which The ERL has no clue, is a “spout again in such disparaging terms”
Please, just what need be considered except the ERL attack on any that may even question the veracity of the fantasy nonsense promoted by the ERL?
LikeLike
Must be some history…Earl has been nothing but a gentleman AND its good to see traffic increasing at his site. Guts and determination is what I see.
LikeLike
Macha says: May 16, 2016 at 10:03 pm
“Must be some history…Earl has been nothing but a gentleman AND its good to see traffic increasing at his site. Guts and determination is what I see.”
Yup! Erl is quite polite as long as you are asking the ERL to expound on his version of how this atmosphere operates. Then thank him, so he thinks you understand, and agree with his version. Richard only asked “if the -energy exchange levels been worked out to confirm ozone is a “greenhouse gas”?” This “is” disparaging to Erl as it questions Erl’s authority on what gas may have such a label!
LikeLike
Erl,
I have a some simple questions that you can probably answer easily. (Started as one question then morphed into quite a few. Sorry) First forgive me if I have not paid enough attention so far. Preamble- In NZ we are continually being chastised by our betters in the medical industry that we have the highest skin cancer rate in the whole of the world. We are told that this prevalence of melanoma is getting worse, whatever that means. Then we are told emphatically that it is due to human effects on the “ozone layer” which is then said to be thinning. This goes on then to exhortations from the professional worriers that we need to cover our skins in potions and fabrics like never before so that we can avoid becoming unfortunate statistics in the “battle” against melanoma.
From a lifestyle perpective in NZ we tend to expose ourselves to the sun in the summer to early autumn rather than in the early to middle spring time. We are more sedentary, these days spending more time indoors than ever before. So come summer-time we are probably paler than ever before, ripe for a really good UV caused sunburn. Sunburn we are told, is a strong contributing factor in the later development of melanoma.
Ozone is supposed to soak up the UV radiation reaching the Earth from the sun. The story goes that if the ozone is attenuated in the atmosphere above us then we will be exposed to more UV radiation. We will consequently be liable to aquire sunburn more quickly and the burns will be more intense.
But what I am seeing from the images you present is that the “ozone hole” is localised over mainland Antarctica, mostly south of latitude 65 degrees. It is almost entirely a springtime atmospheric phenomenon. There is a doughnut-like ring of elevated ozone content around the “hole” when the hole is in its most intense state of development.
So at the latitude where most Kiwis and Aussies live (say 30 to 50 deg South) have we actually been subjected to a decrease in total column ozone or actually has it been an increase? Has there been ozone depletion over mid-southern latitudes? If there has been a decrease then a what time of the year? In other words, during the seasons in which we bare our skins to the sun are we better protected from UV radiation or are we less protected than previously?
Have we been subjected to the truth regarding ozone and UV radiation or merely expensive propaganda? If the answer is propaganda then are our efforts to minimise exposure to UV radiation during all seasons really going to be effective? Or, are we likely to find these efforts to be counterproductive?
As a youth my strategy for avoiding sunburn was to get out into the sun as early in the spring as possible and build up a good suntan, which was then sufficient to prevent burning throughout the spring/summer/autumn. This meant I had to suffer a couple of slight roastings to get a nice olive-brown colour onto the skin. I find that this is method still works for me over 40 years later so long as I can spare the time to get toasted. I supect this is the real problem. These days we don’t get enough time to sunbathe early in the season and we suffer from it later on.
In our part of the world we do have particulalrly clear skys on fine days. In other words the solar radiatiuon that gets to the surface is quite intense. Would a systematic change in cloud cover, wind speed and wind direction influence the degree to which we are exposed to UV radiation?
Feeling better here after a nice brain-dump. Do you have any thoughts?.
LikeLike
HI Rob,
Nothing quite so satisfying as a good story. And nothing quite so welcome as a good question.
Here is a good site to check Total Column Ozone as it evolves day by day. http://macc.copernicus-atmosphere.eu/d/services/gac/nrt/nrt_fields!Ozone!Total%20column!36!S%20Hemisphere!macc!od!enfo!nrt_fields!2016051600!!/
Another site that shows the progression of ozone according to chosen intervals is here: http://macc.aeronomie.be/4_NRT_products/5_Browse_plots/1_Snapshot_maps/index.php?src=MACC_o-suite&l=TC
A site to check the UV index on a daily basis:http://www.temis.nl/uvradiation/UVindex.html
A site to check the historical record for particular locations including Paraparaumu, NewZealand and Punta Arenas in Chile. You could download, graph and compare historical data.
Ozone circulates with the air masses in an east west movement but that said it tends to build at particular locations favourable for the development of consistent low pressure. One such is between Antarctica and New Zealand/Australia where there is a depression in the Antarctic coastline. Its the ozone that is responsible for the low pressure because it favours convection. There is strong build up of ozone over such locations at 10 hPa. So these locations starve the surrounding atmosphere of ozone.
There is a zone over the ocean to the west of South America that favours the development of high surface pressure and this part has little ozone. The Andes are high mountains. In Spring the Ozone hole is frequently observed to swing over South America. I have read that in the high Andes the suicide rate peaks in spring.
So, within the southern hemisphere there are favourable places to live and less favourable but the entire hemisphere is subject to damaging levels of UV light in spring and summer when we take to the tennis courts and the beaches.
There is no doubt that UV light is damaging to the skin and to plant tissue. I have a polycarbonate roof over an enclosed area between two sea containers. Apart from being a wonderfully warm place in winter (has to be covered in summer) plants thrive and the colours are vibrant.
I grow my grapes on a large trellis that offers more space for the annual shoot growth to both originate and to spread. The grapes develop a different colour, the reds deeper and the whites less green and more golden with touches of brown colouration on the skin. There is less green flavour, more ripe flavour and more phenolic (tannin) backbone. The wines live longer and develop better and to my taste are superior.
I am bald, without a hat, in daylight my scalp hurts so I wear a broad brimmed hat. But I have spent a lot of time in the sun over my lifetime. Too much sun gives me a headache. An Irish German heritage gives me light coloured skin. Its no accident that the Australian aboriginal is very dark skinned. It’s an evolutionary adjustment.
Gradually falling temperatures in the stratosphere at 60-70° south (and all points north), in spring, indicate declining ozone levels. That is nothing to do with the ozone hole. It represents a gradual return to pre 1976 conditions.
The ‘ozone hole’ is a localized affair that develops over the Antarctic continent as the current post demonstrates.
The generalized increase in UV exposure in the southern hemisphere in spring is possibly due to the increasing elevation of the sun, a shortening atmospheric path and the increased photolytic destruction of ozone by short wave radiation from the sun. But it could also relate to enhanced uplift of NOx in low latitudes. The long term trend is governed by the flow of mesospheric air into the atmosphere over the pole. That will increase as surface pressure over Antarctica recovers, a process already under way.
What I say is not driven by a desire to appear to be a know-all. Its the product of many years of observation and an intensive exploration of the reanalysis record here: http://www.esrl.noaa.gov/psd/cgi-bin/data/timeseries/timeseries1.pl
That database is the only decent archive we have of the history of the atmosphere. Of course its all based on careful extrapolation and there is no place where the extrapolation is more heroic than in the southern hemisphere. That said many nations have maintained bases for observation in Antarctica since the 1950s so we can be fairly confident that the data for the high latitudes of the southern hemisphere is pretty well grounded in observation.
Its these high latitudes of the southern hemisphere where the atmosphere changes most spectacularly.
Its customary in the climate establishment to suggest that the data is suspect because they can’t explain the changes and nor do they want to. The are very comfortable in their fantasies.
LikeLiked by 1 person
“HI Rob,
Nothing quite so satisfying as a good story. And nothing quite so welcome as a good question.
Here is a good site to check Total Column Ozone as it evolves day by day. http://macc.copernicus-atmosphere.eu/d/services/gac/nrtnrt_fields!Ozone!Total%20column!36!S%20Hemisphere!macc!od!enfo!nrt_fields!2016051600!!/
All is but your nonsense fixation on atmospheric O3 solar farts, Others have fixations on CH4 (methane) cow farts. then chicken NO2 farts, Human combo-smelly farts. and the biggy, electrical generation CO2 farts. There is absolutely no evidence that any of these (farts) affect surface or atmospheric temperature in any way. Total atmospheric column water in three phases and two airborne condensates dominate all of near surface Earth temperature. There is not even one iota of evidence that any or all Earthlings have
LikeLike
A clue!!!
LikeLike
Forgot the site for checking UV index for particular places: It’s here: http://www.temis.nl/uvradiation/SCIA/stations_uv.html
LikeLike
Thanks Erl
LikeLike
Will Janoschka,
I can’t understand why you need to be commenting here at all. So far your intrusions have been unhelpful and not in any way insightful. This is Erl’s personal website and he can answer others in any way he chooses. With regard to your beef about his answer to a comment by someone other than you it is basically not your business.
By the way we all know that water, in its three phases, is the dominant greenhouse gas through most of the troposphere at most times. We don’t need you to remind us of this. I suspect that Erl, and most other skeptics (including me) have already done our own investigations into CO2 and CH4 and concluded that there is not much to worry about. So your drive-by insinuations and comments on various sorts of farts do only serve to give us an indication of an unattractive part of your personality.
Erl is merely looking at the role of another “greenhouse gas”, asking questions, obtaining data, looking for answers and discussing his findings. This website has been devoted to discussion of the creation, destruction and effects of ozone in the atmosphere. These effects can be isolated from discussions relating to water vapour. If you (Will) can’t get your head around this then why do you even visit this site? Why not start your own blog to discuss the impact of atmospheric water on the climate?
LikeLike
Rob R says: May 18, 2016 at 5:59 am
“Will Janoschka, I can’t understand why you need to be commenting here at all. So far your intrusions have been unhelpful and not in any way insightful. This is Erl’s personal website and he can answer others in any way he chooses. With regard to your beef about his answer to a comment by someone other than you it is basically not your business.”
The answer: From the Jonova site,
Erl Happ May 11, 2016 at 10:02 am
“11.1 is ill mannered in the extreme. What joy do you derive from venting your spleen
There are none so blind as those who will not see:
https://reality348.wordpress.com/2016/03/26/17-why-is-the-stratosphere-warm/”
Perhaps Erl might learn from his own advice!
Erl Happ May 12, 2016 at 10:56 am
“Will, take your objections to my blog and I will answer you there. And be specific if you really want an answer.”
I generally do not follow the demands of others, but here I are!
This subject “this fantasy of O3 significantly affecting Earth’s weather” is my business because I make it my business! This fantasy is no different than the CO2 fantasy!
So far the ERL has not even tried to answer even one of my specific questions!
How much atmosphere does this Earth have?
Why does this Earth have just that much atmosphere?
How can I be more specific?
LikeLike
Rob R says: May 18, 2016 at 5:59 am
“Will Janoschka, By the way we all know that water, in its three phases, is the dominant greenhouse gas through most of the troposphere at most times”
There air no atmospheric components that contribute to anything, in the manner described by climctastrophists as “greenhouse effect”! Some atmospheric components can and do attenuate the higher frequency, temporal or spatial modulation of Earth’s surface exit flux, when generated! None of these atmospheric components, no-mater how opaque, ever decrease the accumulating exit flux at each and every wavelength with increasing altitude, all the way to 200km!
Besides the solid, liquid, and gas phases of atmospheric H2O are the two airborne colloids between those phases. This Earth’s atmosphere continually contains much more colloidal H2O than is in the other three phases. It is only the shifting of these phases between sunside and nightside that have any measurable effect of spreading insolation power to all portions of this atmosphere for eventual discard to space via atmospheric EMR exit flux!
LikeLiked by 1 person
I am in complete agreement with the proposition that there is no greenhouse effect though I would express the argument differently to the above.
However, this does not any any way change my opinion that a gas that is unequally distributed, namely ozone does absorb at 9-11 um imparting energy to adjacent molecules and in so doing changes the density of the air locally giving rise to a movement of the air that we call wind. Furthermore I will maintain that the heating effect of this process is responsible for the strong winds that manifest between 500 hPa and 50 hPa including the jet streams. Furthermore, the flux in the ozone content of the air in high latitudes in winter drives temperature, density differences, geopotential height and the generation of polar cyclones, collectively responsible for (second order) shifts in atmospheric mass on all time scales and flux in cloud cover and the planetary winds. First order shifts are a matter for the Earths electromagnetic field.
Colloquially ozone is described as a ‘greenhouse gas’ because it absorbs in the long wave. I have discussed this matter here: https://reality348.wordpress.com/2016/03/26/17-why-is-the-stratosphere-warm/
The observed winter maximum at the tropopause at latitude 30-40° south and the lack of any evidence of downwards propagation of energy demonstrates that the hypothesised greenhouse effect is un-physical…it is not born out in nature. Nature provides a test bed for the theory and the proof is there.
Assertion is one thing. Proof is another. As to whether a person accepts the ‘proof’ or not, that is another matter entirely.
My thesis will be judged on the weight of the evidence that I provide. And I am less than half way through.
Manifestly, the temperature of the ‘ozonosphere’ is a product of energy flows incoming in the short wave and outgoing in the long wave. Anyone who wants to maintain that it is entirely the result of incoming short wave radiation is deceiving themselves. My argument is in the post referenced above and I am perfectly willing to debate the matter under that head.
By the way, people have no trouble accepting that the presence of water vapour in the air makes that air less dense. There are two reasons for this. One relates to the atomic weight of water and the other the responsiveness of water to long wave radiation. Water, like ozone is not uniformly distributed.
LikeLike
erl happ says: May 18, 2016 at 1:52 pm
“I am in complete agreement with the proposition that there is no greenhouse effect though I would express the argument differently to the above.”
Thank you! Any way to to express this better is much appreciated!
“However, this does not any any way change my opinion that a gas that is unequally distributed, namely ozone does absorb at 9-11 um imparting energy to adjacent molecules and in so doing changes the density of the air locally giving rise to a movement of the air that we call wind. ”
Can you express your source for, “ozone does absorb at 9-11 um”? I only wish this info so I can evaluate your background on thermal EMR its generation and propagation, for some meaningful response to you! I imply no derision at all. If you have much training and experience in EMR, dialog can proceed at a high level. If your statements are from the internet, popular press, NASA Goddard, or NOAA, then only a discussion of the veracity of the source need be discussed. The observed result between claims of any of the above vs the physical measurement speak for themselves!
LikeLike
Will, I don’t have to rely on an authority. The air is warmed in winter at 300 hPa where there is no short wave to do the warming. The air is warmed in the polar night where there is no short wave. The presence of ozone is inferred and measured by satellites by observation of the signature of ozone in outgoing radiation, a deficit in the 9-11 um wave length that amounts to almost 50% in terms of available energy. It’s massive. All this I document in the post which you have apparently not deigned to read. The warming due to outgoing radiation is apparent in the hovmoller diagram at 10 hPa. There is very little diurnal variation in temperature in the upper stratosphere. You can observe the warming in the data from radiosondes and that warming relates to the incidence of ozone rather than the incidence of short wave radiation. The incoming wave lengths that directly heat the atmosphere are tiny and in the main exhausted above 1 hPa. The energy available from the short wave source below 10 hPa is vanishingly small. On the other hand the outgoing radiation is compressed about and it peaks very close to the wave length absorbed by ozone.
Really, Will you are out on your own with this statement. You are contradicting the observation of all those who have done the spectral absorption work over 100 years or more.
Here from 1979, http://www-ramanathan.ucsd.edu/files/pr24.pdf The presence of ozone in the troposphere and a discussion of radiative energy balances…….not the point at all. The real point relates to changes in the density of the air and resulting air flows. As much outgoing energy is absorbed by ozone in the troposphere as in the stratosphere due to density considerations. If the molecule can download fast it accumulates again and the cycle of heating is faster.
LikeLike
erl happ says: May 18, 2016 at 4:16 pm
“Really, Will you are out on your own with this statement. You are contradicting the observation of all those who have done the spectral absorption work over 100 years or more. ”
Erl Why do you refuse to reveal the source of your misinformation! All of the observation and measurement of atmospheric attenuation by atmospheric gas components of higher frequency spatial or temporal modulation was only started after 1967 and after the obscene price paid to chemists for measuring such attenuation in a laboratory at every temperature and pressure! There remains no possible way to distinguish EMR flux propagating through a dispersive atmosphere from that flux originating from that same atmosphere. The measurement of attenuation of the forced temporal modulation of source, along with synchronous demodulation for measurement is the only in situ measurement of this atmospheric attenuation. I know, I was there, I did it! Again at an obscene price.
Your source from where/whenever is but the complete intentional corruption of every value produced then field verified, that makes up the HiTran data base. Can you not even try to accept that you to have been Globally SCAMMED? Your claim that stratospheric O3 temperature is affected in any way via 9.6 micron surface EMR is truly ludicrous!
LikeLike
Will, my observations are plainly insufficient, although you choose not to say why. So, this conversation is getting nowhere. Assertions that take no account of what is observed don’t cut it for me.
You insist on references and they are abundant despite the IPCC, and yourself maintaining that the temperature of the stratosphere is due to the impact of short wave ionizing radiation on the atmosphere.
The following paper shows the attenuation of the infrared spectra via ozone absorption at 9-11um. For these energy spectra to be depleted, the ozone molecule and the air about it will necessarily acquire kinetic energy and this, given the uneven distribution of ozone in the horizontal domain will produce differences in density and result in a movement of the air. The attenuation amounts to some 50% of the energy emitted at 9.5 to 10um where the energy available in outgoing infrared is massive.
The result of this energy absorption is the attenuation and reversal of the lapse rate at what is called the tropopause. The only short wave that gets down to the tropopause is UVC and the energy attached to any possible interactions is miserably small, quite inadequate to the task of reversing the lapse rate.
http://onlinelibrary.wiley.com/doi/10.1029/2005JD005845/full
Abstract
This paper presents the first retrievals and validations of ozone vertical distributions from a set of high-resolution nadir thermal infrared measurements. These were obtained by the Interferometric Monitor for Greenhouse gases (IMG) instrument, which has operated on board the Japanese ADEOS platform between 1996 and 1997. The Optimal Estimation Method is used for the retrievals, along with a priori profile and covariance matrix built from model climatologies. We compare the retrieved IMG profiles with high-vertical-resolution ozone sonde measurements. Therefore we selected a set of IMG spectra collocated to within 3° of longitude and latitude with a representative distribution of ground-based stations. We demonstrate that thanks to the two to four independent pieces of vertical information contained in the spectroscopic measurements with a maximum sensitivity in the upper troposphere–middle stratosphere, the thermal infrared nadir sounders are able to capture most of the ozone spatial and temporal variations. In particular, the latitudinal variations of the stratospheric ozone maximum are well represented in the retrievals, as are the high ozone concentrations observed in the upper troposphere–lower stratosphere at northern midlatitudes during springtime. Ozone depletion events in the Arctic vortex are also well reproduced. The measurements provide an accurate view of the tropospheric ozone content, except when the latter is very low.
Will, why is the tropopause at 30-40° south latitude warmer in winter than it is in summer? Is there more UVC to be had in winter?
LikeLike
erl happ says: May 18, 2016 at 8:42 pm
“The only short wave that gets down to the tropopause is UVC and the energy attached to any possible interactions is miserably small, quite inadequate to the task of reversing the lapse rate.”
Indeed and what happens that prevents any shorter wavelength from reaching the tropopause. Have you calculated the total UV insolation in watts continuously captured by stratospheric O2 in its conversion to O3? Compare that to any possible accumulation of IR flux by O3 from any lower altitude.
Are you of the idea that EMR insolation, surface radiance or surface exit flux create a atmospheric thermal lapse rate? From where did you get such an idea? Please praytell what it is that you are reading? Lapse rate results ONLY from gravitational compression of a compressible fluid surrounding a sufficiently large amount of incompressible mass (planets). There is not one planet in this Solar system whose negative lapse with respect to altitude does reverse and become increasing temperature with altitude between pressure altitudes from 12kPa up to 2 kPa altitude. This is quite independent of the planets atmosphere having oxygen or not. Mars has such low gravitational compression and surface pressure that it does not even have a lapse rate.
(“Ozone depletion events in the Arctic vortex are also well reproduced. The measurements provide an accurate view of the tropospheric ozone content, except when the latter is very low.”)
Your referenced article is well done and I find no error. However the article makes absolutely no reference as to why stratospheric temperatures are what they may be at any latitude.
Have you read That paper? What does figure #1 mean to you? Most all of the other figures come from computer simulations (guesses) not measurement.
“Will, why is the tropopause at 30-40° south latitude warmer in winter than it is in summer? Is there more UVC to be had in winter?”
I have no evidence that what you claim is correct! Is your claimed tropopause an altitude range a pressure range or a temperature range? I have never measured such! A far as I can find the highest altitude, lowest atmospheric measured temperatures, at altitudes lower than the stratopause altitude, 50km, at 30-40°S latitude remains definitely not what you claim. Does your claim come from some other computer model? UVC has nothing at all to do with determining tropopause temperature at any latitude! Nor does stratospheric O3!!
LikeLike
RE: “Will, why is the tropopause at 30-40° south latitude warmer in winter than it is in summer? Is there more UVC to be had in winter?” I have no evidence that what you claim is correct!
And you wont get it unless you investigate the data as I did. I don’t rely on others. Where I can, I spend the time and do the thinking. You too can do it with data from here: http://www.esrl.noaa.gov/psd/cgi-bin/data/timeseries/timeseries1.pl
RE: what happens that prevents any shorter wavelength from reaching the tropopause:
I cover that in the post. Why not read it? You will find more argument that represents my observations. These observations don’t have to be substantiated with references, in fact they simply can’t because they are original to me. They stand or fall as interpretations of complex phenomena that you can adopt or discard according to your own interpretation. All I ask is that you give them consideration. That’s why I take the trouble to write. I am not all all interested in scorn or sarcasm. In my book that is best left out of the discussion of matters of community concern that takes place between men of good will. If you think them unworthy of your attention then don’t bother.
Should you deign to bother, I will in turn give your argument my best attention. That will not include providing answers to questions that are unrelated where it turns out you have nothing to teach me. I am keen to learn. I don’t like making mistakes. I proffer my interpretation as a considered opinion. And I do it for free.
LikeLike
Rob R says: May 18, 2016 at 5:59 am
Will Janoschka, “Erl is merely looking at the role of another “greenhouse gas”, asking questions, obtaining data, looking for answers and discussing his findings. This website has been devoted to discussion of the creation, destruction and effects of ozone in the atmosphere.”
Not at all, the ERL here and at any other available site like Jonova and Tallbloke actively promotes the ERL’s fantasy of Ozone affecting the weather. He does this by claiming that the stratosphere, along with its ozone, has a temperature above that of the tropopause because of “warming” from surface EMR at 9.6 microns. Nothing could be further from anything measurable!
Stratospheric Ozone is continually produced via the less than 0.2 micron insolation. This production is only where it is needed, sunside, in the tropics, to protect all surface life from solar damage. This powerful transition gas quickly ‘burns’ stratospheric N2. From the tropics some ozone is trapped by elevating H2O microscopic ‘snow’ and transported poleward by the stratospheric convection/circulation cell. Near the poles with low temperatures this ozone is inhibited from ‘burning’ N2 molecules, thus it collects at these locations.
Little is known of the operation of this atmosphere, so any actual investigation of any atmospheric component is quite welcome! It is only the wild assed claims, with no thought, and no due diligence that are very, very, unwelcome! Do I still have a question for the ERL? Yes! ‘How much atmosphere does Earth have?
LikeLike
Lead on Will, give us your story. How much atmosphere does the Earth have? And why is it important to know?
Try and couch it in the sort of language that you would use if you were talking to a 12 year old in the presence of his/her mother.
Tell us where the atmosphere comes from and how its lost, and where it goes to when we lose it? Always ready to look at another point of view.
LikeLike
erl happ says: May 18, 2016 at 11:43 am
“Lead on Will, give us your story. How much atmosphere does the Earth have? And why is it important to know? Try and couch it in the sort of language that you would use if you were talking to a 12 year old in the presence of his/her mother.”
Actual answer: No one knows! Meteorology claim, 5.2 x 10^18 kg. From applied geometry and Calculus it can be no more than one third that amount! The amount is important so consideration of huge atmospheric mass motion can be given its approximate momentum and possible physical effects from such motion! A factor of three off is not acceptable!
For weather, the amount of atmospheric columnar water is estimated at average 2.4-2.8 cm, with up to ten times that amount in the tropics. The amount of H2O that ‘can’ be atmospheric gas has a strict upper limit increasing with increasing temperature. If total atmospheric air-mass is less than 2x 10^18 kg most of that airborne H2O is colloid, not a gas with its high latent heat. This revelation would completely turn all of the social science Meteorology on its head once and for all! Go back to gathering twigs and sketching meaningful diagrams in the sand! Nodding up and down or sideways! Here peer review means staying alive!
“Tell us where the atmosphere comes from and how its lost, and where it goes to when we lose it? Always ready to look at another point of view.”
Actual answer: Again no one knows! The best guesses are accumulation from space by gravitational compression, and/or planetary release of volatiles from the surface. Gravitational compression of the atmosphere seems to create surface pressure that limits the release of volatiles to match the loss of H2 back to space.
LikeLike
Agreed, the amount that is colloidal or aerosol by comparison with that which is gaseous is a very important matter to get right. Relative and absolute humidity are not hard to measure. Aerosol is on top of that. Would include ice crystals with great reflective power.
But hang on: Heat released to the atmosphere due to latent heat of condensation and sublimation relate to the measurable portion so that particular driver of atmospheric motions should not be hard to estimate.
What you seem to be saying is that that we/you have no real idea of the physical forces behind the global circulation of the air. Elsewhere you seemed to be placing emphasis on the energy acquired in the tropics.
If in doubt then, my observations should be of interest to you.
Fact is that a lot of people are interested in ‘tracers’ that indicate the source of the air. The atmosphere is least homogeneous at the winter pole. It is there that the largest differences in surface pressure manifest. For my money those differences in surface pressure are locally generated and not a product of energy picked up in the tropics. There is a common sense rule to be followed. The largest responses tend to be seen close to the source of the energy that gives rise to those responses. The waves of the ocean are higher in amplitude where wind strength is most severe. The travelling wave loses amplitude as it travels.
LikeLike
erl happ says: May 18, 2016 at 2:17 pm
“Agreed, the amount that is colloidal or aerosol by comparison with that which is gaseous is a very important matter to get right. Relative and absolute humidity are not hard to measure. Aerosol is on top of that. Would include ice crystals with great reflective power.”
I think you are starting to “GET IT”. The complexity of this Earth atmosphere is so vast! No wonder local earth GOD hired the honorable invisible purple kangaroo to manage such!
“But hang on: Heat released to the atmosphere due to latent heat of condensation and sublimation relate to the measurable portion so that particular driver of atmospheric motions should not be hard to estimate.”
The problem is that there are no hydrostatics or aerostatics to form a reference. We must start at the dynamic! Do you have a couple of aspirin? 🙂
“What you seem to be saying is that that we/you have no real idea of the physical forces behind the global circulation of the air. Elsewhere you seemed to be placing emphasis on the energy acquired in the tropics.”
To me the day to day dynamic is completely powered by Solar EMR flux. The long term sources of “Ice ages” and “medieval warm period” are completely disjoint from Solar EMR flux.
LikeLike
Perhaps when you have unburdened yourself on that subject you might feel inclined to comment on the subject of my post. But don’t rush into it, first about the weight of the atmosphere, the ‘how much’ question and the ‘why precisely that much’ question.
LikeLike
erl happ says: May 18, 2016 at 11:49 am
“Perhaps when you have unburdened yourself on that subject you might feel inclined to comment on the subject of my post. But don’t rush into it, first about the weight of the atmosphere, the ‘how much’ question and the ‘why precisely that much’ question.”
It remains very difficult to have meaningful dialog with a robot that can only point to some reference from elsewho!
I asked ‘you’ two questions that you promised to answer! Have you the capability of carrying out your promises?
LikeLike
Hey Will…. I second the earlier motion for you to run your own blog and put your scientific communication skills on the line instead of pulling apart someone elses ingenuity and good old fashioned gumption. That way you can say whatever you like and leave others to theirs. Afterall, what Earl or anyone else does should make no real difference to you. Many people even run blogs as a hobby ie. have some other “day Job”. In short, I tend to listen more to those that show respect, humility and empathy for the creators not the draggers,taggers, and trollers. But that’s just me.
LikeLike
Macha says: May 18, 2016 at 7:39 pm
“Hey Will…. I second the earlier motion for you to run your own blog and put your scientific communication skills on the line instead of pulling apart someone elses ingenuity and good old fashioned gumption. That way you can say whatever you like and leave others to theirs. Afterall, what Earl or anyone else does should make no real difference to you. Many people even run blogs as a hobby ie. have some other “day Job”. In short, I tend to listen more to those that show respect, humility and empathy for the creators not the draggers,taggers, and trollers. But that’s just me.”
I see no motion put forth, or any evidence of ‘whom it may be’ for such motion putting.
Erl has my email! Please forward your proposal for the creation of ‘My blog’? I perhaps, if liking your proposal, may reply with my hourly rate for creating and maintaining such a blog.
If you want Satire, contact Brad Keys! If you want Scorn and Sarcasm I have lower fees!
LikeLike
Erl can see a strong wave in the stratosphere.
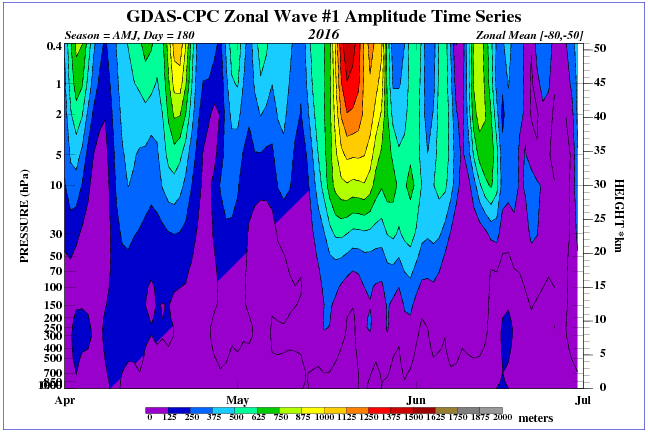
LikeLike
Polar vortex about 27 km.
https://earth.nullschool.net/#current/wind/isobaric/10hPa/orthographic=-225.00,-70.83,300
LikeLike
REn, That data is at the 10hPa level. It represents an anomalously vigorous zone of descent at the 10hPa level. It means very little below that level. The stratosphere above 70hPa has a different dynamic to that below. The 10hPa level and above are accumulation zones where air ascending in the annular ring of polar cyclones carries ozone into the upper stratosphere. What goes up must come down. Some of it will find its way to the mid latitudes and feed high pressure cells.
LikeLike
erl happ says:May 20, 2016 at 12:22 pm
“Will, That data is at the 10hPa level. It represents an anomalously vigorous zone of descent at the 10hPa level. It means very little below that level.”
To what data are you refering? 10hPa, 1kPa, is a nominal 26km altitude (from someone’s table) This can be al low as 13km at the poles to almost 45km sunside equator. That decent at the poles is the decent of the water laden tropical air all the way into the stratosphere, mostly as microscopic snow. The stratospheric circulation cell.
This snow precipitates at the poles as it is too dense to stay within the streamlines of the compressible gas as that gas curves back equator-wise below 1.5 km above surface (almost 5km above sea level for the Antarctic. This is the air that combines with tht Polar cell on decent with increasing eastward vorticity. Near the surface this airmass slows to surface eastward velocity but still toward the equator. At about 60° latitude and 3 km above this airmass combines with the low altitude poleward Ferrel cell to become the upward leg of the Polar-Ferrel cells. Most of the pressure distortions you have deduced are from airmass motion not gravitational compression. Most, but not all, that you attribute to the effects of O3 are but these mechanically induced well noted circulations.
“The 10hPa level and above are accumulation zones where air ascending in the annular ring of polar cyclones carries ozone into the upper stratosphere. What goes up must come down. Some of it will find its way to the mid latitudes and feed high pressure cells.”
Again I cannot decode what you may mean by the 10hPa level. As Always the pressure at any altitude, latitude, time of day, and month of year are strongly influenced by local airmass motion. So strongly that all attempts to aggregate or low-pass filter the values completely destroy all meaning to that average! You simply cannot start at a static values (called the attractor) and obtain meaningful results.
LikeLike
Will,
I take my heights and pressure intervals here: http://www.cpc.ncep.noaa.gov/products/stratosphere/strat-trop/
LikeLike
erl happ says: May 20, 2016 at 9:53 pm
“Will, I take my heights and pressure intervals here: http://www.cpc.ncep.noaa.gov/products/stratosphere/strat-trop/?”
Thank you Erl,
I am beginning to learn where you are coming from! I do not know your location! If you are near LA or Seattle, the place is overrun with aeronautical engineers, some of them with 45 years of experience, while never publishing anything in any “peer reviewed prestigious journal”! 😉 These are the guys that been tinkering with this atmosphere, not writing for prestigious journals. Go to anywhere that these folk hang out. Take your NASA/NOAA/NCAR cartoons with you and after buying a couple of rounds, to become a good guy, ask the least qualified to give you his take on what those charts may mean. Expect an answer such as “this makes no sense to me”! This is the start! Repeat that once each week, not more. After two months they will pass your question on to those that can, answer, and may come visit.
Ask now “this makes no sense to me, but was published by this governmental agency, can you help?” Couple weeks later, if you brush up of you engineering lingo, and loose the meteorological lingo. They will have checked you out. From there it all depends on you being a good guy, like you, or being an asshole, like me! I remain fed up to “here”, with this BS, for 42 years now!
LikeLike
Wave 30 and 50 hPa.
LikeLike
AAO indicates high surface pressure over Antarctica. There is also an anomalous zone of very cold descending air at 250hPa over the Antarctic Peninsula.
30hPa and 50hPa anomalies indicate that the zone of descent of warm air that shows up at 10hPa is actually warming the air that currently sits over the Southern Ocean near Australia. Null school shows a lot of warmth at 70hPa in this zone between New Zealand and Antarctica. So, that is also showing up in the GDAS analysis of Geopotential height at lower altitudes but the warm air is being left behind as the upper air transits around the pole at a faster rate.
What is of interest is what happens to the vortex and the zonal wind over Antarctica as this pattern develops. You can see how that warm zone at 10hPa materialized in the Indian Ocean near Madagascar about the 10th and moved towards Australia (null school). Forecast is for central pressure over Antarctica to fall away over the next four days. Let’s see if the forecast is accurate and the warm zone displaces the polar vortex so inducing low surface pressure or whether the vortex stays in place and the so called wave dissipates. This is a good test for planetary wave theory.
LikeLike
HI Ren, that 50hPa temperature anomaly in the Arctic shows warm air flooding the Arctic at that level. Its a good illustration of the stratification of the wind in high latitudes of the sort that occurs in the creation of the ozone hole in spring in the Antarctic. An anomaly represents a departure from the average and the average is changing behind the anomaly all the time. If we look here: http://www.cpc.ncep.noaa.gov/products/stratosphere/strat_a_f/ we see that the Arctic has had its final warming. Here: http://macc.aeronomie.be/4_NRT_products/5_Browse_plots/1_Snapshot_maps/index.php?src=MACC_o-suite&l=TC
we see that the Arctic has a warm, ozone rich core and no evidence of any vortex.
LikeLike
Erl, some do not acknowledge that the waves in the mesosphere and upper stratosphere is induced by the effects of ionizing of the solar wind and GCR.
LikeLike
If someone wants to create a long-term weather forecasts must take account activity of the sun, especially during long periods of low activity. This is a new situation, because such a low solar activity was 100 years ago.

LikeLike
ren says: May 20, 2016 at 5:02 pm
“If someone wants to create a long-term weather forecasts must take account activity of the sun, especially during long periods of low activity. This is a new situation, because such a low solar activity was 100 years ago.”
Ren,
Do you have any data that shows the mass by your mesosphere waves actually resulting in measurable mass transfer through the tropopause, even at the poles? How might mesospheric mass get through the stratopause at near 0°C, without taking on that temperature? Since density is so very low this poses a real conundrum. Although the mass is low, indicating rapid response to differential pressures. The pressure changes may affect coherent mass motion in any direction little or none. Are the pressure changes sufficient to create measurable direction changes, or may the apparent pressure changes only modifying the repulsive electron coulomb forces between molecules? These are described as “charged” particles are they not? Has not this effect at these low pressures via moving ions been measured in the laboratory? What type of instrumentation is being used for these measurements. Always looking for what this may not be.
Thank you.
LikeLike
Upper Atmosphere
The Earth’s atmosphere has four primary layers: the troposphere, stratosphere, mesosphere, and thermosphere. These layers protect our planet by absorbing harmful radiation.
Thermosphere 53–375 Miles – In the thermosphere, molecules of oxygen and nitrogen are bombarded by radiation and energetic particles from the Sun, causing the molecules to split into their component atoms and creating heat. The thermosphere increases in temperature with altitude because the atomic oxygen and nitrogen cannot radiate the heat from this absorption.
Mesosphere 31–53 Miles – Studying the mesosphere is essential to understanding long-term changes in the Earth’s atmosphere and how these changes affect climate. Since the mesosphere is responsive to small changes in atmospheric chemistry and composition, it could provide clues for scientists, such as how added greenhouse gases may contribute to a change in temperature or water composition in the atmosphere.
Stratosphere 10–31 Miles – The ozone layer lies within the stratosphere and absorbs ultraviolet radiation from the Sun.
Troposphere 0–10 Miles – The troposphere is the layer of the Earth’s atmosphere where all human activity takes place.
Ionosphere – The ionosphere is a layer of plasma formed by the ionization of atomic oxygen and nitrogen by highly energetic ultraviolet and x-ray solar radiation. The Ionosphere extends from the middle of the mesosphere up to the magnetosphere. This layer cycles daily as the daytime exposure to solar radiation causes the ionization of the atoms that can extend down as far as the mesosphere. However, these upper atmospheric layers are still mostly neutral, with only one in a million particles becoming charged daily. At night, the ionosphere mostly collapses as the Sun’s radiation ceases to interact with the atoms in the thermosphere. There are still small amounts of charged atoms caused by cosmic radiation.
Communication – A unique property of the ionosphere is that it can refract shortwave radio waves, enabling communication over great distances by “bouncing” signals off this ionized atmospheric layer. Variability of the ionosphere can interrupt satellite communication, such as errors in GPS signals for commercial air navigation. During solar storms, this layer can even shut down communication between ground stations and satellites.
Rockets, Balloons, and Satellites – NASA scientists use balloons to collect in-situ measurements in the atmosphere. However, the mesosphere and thermosphere are too high for balloons to reach, so scientists use instruments on sounding rockets and satellites to gather more detailed measurements of the upper atmosphere.
Noctilucent Clouds in the Mesosphere – Evidence of change in the behavior of noctilucent clouds has been observed by the AIM mission. Recent data show dramatically lower ice content, leading scientists to speculate about changes in weather conditions and pole-to-pole atmospheric circulation.
http://www.nasa.gov/mission_pages/sunearth/multimedia/mos-upper-atmosphere_prt.htm
LikeLike
ren says: May 20, 2016 at 8:10 pm
“Upper Atmosphere
The Earth’s atmosphere has four primary layers: the troposphere, stratosphere, mesosphere, and thermosphere. These layers protect our planet by absorbing harmful radiation.”
That is nice inaccurate boilerplate! I am quite familiar with the nonsense! None of that in anyway comes close to answering any of my detailed questions. If you can, please try to answer each question, one by one. I do not know is a fine answer!
LikeLike
If you compare the polar vortex 10 hPa and 70 hPa it is seen that this circulation in the upper layers of the stratosphere affects the circulation in the lower layers, and not vice versa.
https://earth.nullschool.net/#current/wind/isobaric/70hPa/orthographic=-232.87,-52.57,455
https://earth.nullschool.net/#current/wind/isobaric/10hPa/orthographic=-232.87,-52.57,455
LikeLike
ren says: May 20, 2016 at 5:12 pm
“If you compare the polar vortex 10 hPa and 70 hPa it is seen that this circulation in the upper layers of the stratosphere affects the circulation in the lower layers, and not vice versa.”
Indeed near the poles the stratospheric circulation cell still has a large part of the initial 1000 MPH eastward surface velocity from the equator. This mixes with the 500 MPH eastward surface velocity from the 60° latitude which is the upward component of the polar circulation cell! Some idiots call this Coriolis effect! Others refer to such as the simple spherical geometry of a rotating planet!
LikeLike
Ren Have a look at the ozone values here: http://www.cpc.ncep.noaa.gov/products/stratosphere/strat_a_f/
There is a strong warm ascending column particularly from 30hPa upwards south of Australia and there will be an accumulation at 10hPa that may flood over the pole giving rise to a ‘sudden warming’. This reminds me of what happens in the North Pacific between Kamchatka Penisular and Alaska. Its very much a mushrooming effect. Its showing up as high temperature at 70hPa and 50hPa but not yet at 10hPa. In fact its just starting. My guess it will work its way to the top of the stratosphere.
LikeLike
erl happ says:
May 21, 2016 at 12:13 am:
What does this from Piers Corbyn say to you folks? A stratospheric action reconstruction:
LikeLike
Piers reconstruction represents the ozone rich air outside the vortex poorly because it fails to show the surrounding annular ring of ozone. It represents that ring as something that has solid fabric like margins and no ozone in its core as if it were another surrounding vortex. It ignores the intake of ozone rich air into the space inside the vortex that is air from the mesosphere. It ignores the escape of mesospheric air into the annular ring of ozone rich air that surrounds that tongue of mesospheric air. Its weakest element is the lack of visualisation of what is happening between 100hPa and 50hPa where polar cyclones are generated pulling in ozone rich air from one side of the vortex and mesospheric air from the polar cap side mixing them together and sending them to the top of the atmosphere as THE VORTEX of rapidly circulating air. It fails to show the surrounding ozone rich air outside the vortex that can flood over the polar cap when surface pressure is weak and the intake of mesospheric air is reduced, displaced or temporarily ceases.
But this explanation, while it follows the conventional wisdom is less competent again: https://www.youtube.com/watch?v=7VjMe3SDUzs
Neither looks like what we see here: https://earth.nullschool.net/#2016/01/04/0000Z/wind/isobaric/10hPa/overlay=temp/orthographic=-0.59,89.57,410
Toggle up and down the levels and the structure is plain to see.
People who look at the northern hemisphere only never see an archetypal vortex. That’s in Antarctica.
LikeLike
Meanwhile at the surface in the south west corner of Australia the wind is starting to howl from the west and north. Low pressure coming. Ozone aloft. See at 50hPa here: http://macc.aeronomie.be/4_NRT_products/5_Browse_plots/1_Snapshot_maps/index.php?src=MACC_o-suite&l=TC
In fact the whole column from 100hPa to 1hPa is loaded.
LikeLike
XXXXXXX erl happ says: May 16, 2016 at 7:18 am
“Good morning Will, Gordon Dobson invented his instrument to measure total column ozone in the 1920s.”
This is BS. Those instruments measure the difference in surface Earth solar irradiation between very close UV frequencies. As now known (maybe), this is a measure of “rate of production” of ozone from atmospheric O2 and H2O by energetic insolation at wavelengths less than 0.2 microns.
“He was interested to work out why wind strength increased with elevation to the 100 hPa pressure level or thereabouts. Dobson had laboriously tracked the passage of clouds and balloons at different elevations in order to compare wind strengths.”
Sir Dobson was interested in everything. He is revered as the finest physical empiricist ever known. To Gordon, “what was not measurable, was not”. Such dedication to repeatable measurement has been lost to all except few that reject post normal science. Gordon was well aware that philosophical “reality” must contain all, even transient insight, illusion, fantasy, goofyness! Today post modern considers these as not real. All options, feelings are real, but they are not physical (the space/domain/set) of the measurable! What is properly called Physics. Since 1962 Physics has been relentlessly and throughly destroyed.
“He was aware of the work of De Bort who had sent several hundred balloons aloft near Paris and discovered in the process that the point where the temperature stopped falling with elevation was a couple of kilometres lower when surface pressure was lower than when surface pressure was higher.”
The pressure, density, temperature, relationship of gas when volume is constrained is well known! This Earth’s atmosphere is definitely not so volume constrained. Gets kinda weird at times.
LikeLike
Wrong Will, The instrument measures the attenuation of the wave lengths as measured at the surface of the Earth. Ozone finds its way into many places where it is not produced. Production is not simply a matter of oxygen intercepting short wave radiation from the sun.
LikeLike
Hi erl and ren, that south westerley lashing has just reached perth. Woke me up a couple hours ago. 4am sat.. Definitely experience pressure, temperatue changes! What will be interesting is relating weather events ( short term) to prevailing climate. I resist the notion of global climate as it has limited relevance. I prefer the five zones; tropical, arid, polar, continental and moderate. Although in light of this series and others, I see merit in having a northern and southern sub-set of each.
LikeLike
Hi Macha, your observations are on the money.There are two very different hemispheres. This becomes very obvious if you set out to find a ‘homoclime’ (same climate different hemisphere) in the southern hemisphere for something from the Northern hemisphere. The nearest thing to Burgundy that we have in the Southern Hemisphere is Central Otago, a desert locked up inside snow capped mountains.
LikeLike
This blustery weather has been great for re-reading some older chapters. Eg 7&8 were great highlighting the zonal differences. Land/ ocean ratio between North and South, also appreciation of the wind speed at higher altitudes, and at the equator vs the poles. Its too easy to forget how fast the planet is spinning when we are “on the same Train”. Hmmm..more reading to do. Ps. When is this coming together as a Book?. The graphics are fantastic. might compliment David Evans work (that eloquently puts a case where IPCC modellers went astray) that his other half, Joanne nova puts up on her blog. Then again, despite being a modeller myself, their is nothing like raw data from observations to maintain “Reality” – pun intented.
LikeLike
Macha, you are a ‘tonic’.
Will it be a book. I doubt it. Very few people imagine that an explanation is possible. In a human lifetime people live through changes and take it for granted. No, its just an effort to work through the data and find an explanation that makes sense….gratis….its the sort of job that grandfathers take on. When the money doesn’t matter. And the wisdom is important. And the politicians are behaving stupidly.
LikeLike
And the Pinot Noir from Central Otago is at least the equal of if not better than most Burgundies. A shame really as I am more of a Bordeaux blend fan.
LikeLike
In that case you gotta try our Three Hills Charles Andreas.
LikeLike
Recently spent a few hours reseaching West Australian zinfandels with a view visiting the Margaret River area. More as a way to find some vineyards than as a preference in varieties. Trouble is I can’t afford the trip yet.
LikeLike
Guys, there is an important discussion taking place here: http://euanmearns.com/periodicities-in-solar-variability-and-climate-change-a-simple-model/
LikeLike
From the article you link to I find this to be very interesting:
“More reasonable hypotheses are those that propose an atmospheric effect that probably propagates from the stratosphere downwards to the troposphere. The energy for climate and weather manifestations is mainly provided by the poleward heat transport, that is due to more energy entering the Earth in the tropical areas that can leave, so the surplus is transported towards the poles where more energy is leaving the Earth than entering. The intensity of the poleward heat transport depends on the latitudinal thermal gradient (LTG).”
The downward propagation is contrary to the CO2 control knob theory.
It is also notable that at the millenial scale there is a strong cyclical pattern in meridional (poleward) atmospheric temperature gradient and therefore heat transport, and that this matches long-term temperature records over the past 800,000 years in Anrarctica.
LikeLike
Rob R. That’s indeed what I liked about the article. It emphasises the point that the poleward transport of energy is related to the planetary winds that are in turn driven by the annular modes phenomenon whereby atmospheric mass shifts between high and other latitudes in winter driven by stratospheric (related to ozone) processes.
Don’t know if you saw this comment of mine:
Climate scientists should have taken a little more notice of Gordon Dobson when he documented the fact that total column ozone maps surface pressure. Think for a moment. What that means is that the synoptic situation, wind direction, wind temperature and the extent of cloud cover is determined by the ozone content of the upper portion of the atmospheric column. We must look to the stratosphere to understand the troposphere. To understand the stratosphere we need to understand the impact of the sun on the atmosphere, not just in terms of Total Solar Radiance (invariable) but also via the impact of photolysis and the electromagnetic features of the Earth’s atmosphere, both highly variable. The solar wind and Galactic cosmic rays as they affect the atmosphere over the poles become important areas of study. The zonal wind and its variations assumes more importance. The polar vortex gets closer attention. Sudden warmings are given closer attention. Wave theory is re-evaluated. The generation of polar cyclones is re-evaluated. The decline of surface pressure in high southern latitudes is observed and its implications and interrelatedness to change in surface pressure elsewhere is realized. In short we need to understand the A-Z of ozone.
When we look at the stratosphere we must see its fine texture. That texture is concealed by averaging processes. In fact stop averaging altogether. Start looking at textures.
Here are two fundamentally different approaches to understanding climate variation. The wholus bolus process is inadequate, it doesn’t fit the observed pattern of change. If it doesn’t explain what we see it’s useless.
LikeLike
Rob R: https://earth.nullschool.net/#current/wind/isobaric/250hPa/overlay=temp/orthographic=-259.31,-85.36,385/loc=176.704,-47.298
Striking example of a warm core polar cyclone at 250 hPa very close to New Zealand. How is it at the surface?
LikeLike
Much violent cool wet weather, westerly quarter, over much of the country, especially north and south ends. Deep snow Otago/Southland in hills etc.. Has been building all week.
LikeLike
In the south west corner of WA where I am, we have cold, gales and wet but snow is virtually unknown. https://earth.nullschool.net/#current/wind/isobaric/500hPa/overlay=mean_sea_level_pressure/orthographic=-246.53,-80.69,385
Good weather for bed.
LikeLike
This is new. 3 hourly precipitation. https://earth.nullschool.net/#current/wind/surface/level/overlay=precip_3hr/orthographic=-213.18,-35.34,385
LikeLike
Hi Erl,
I’m on the West Side of the South Island, so we are protected at the moment. Fine but cool day here (about 12 deg C). Snow visible down to about 1200 m on the Southern Alps. Probably lower on the East side. Fresh snow on the skifields around Queenstown.
LikeLike
Ren. Climate science is catching up with us:
http://www.sciencedirect.com/science/article/pii/S1364682616300967
A link between high-speed solar wind streams and explosive extratropical cyclones Paul Prikryla, Koki Iwaoc, Donald B. Muldrewd, Vojto Rušine, Milan Rybanskýf, Robert Bruntzg
Abstract
A link between solar wind magnetic sector boundary (heliospheric current sheet) crossings by the Earth and the upper-level tropospheric vorticity was discovered in the 1970s. These results have been later confirmed but the proposed mechanisms remain controversial. Extratropical-cyclone tracks obtained from two meteorological reanalysis datasets are used in superposed epoch analysis of time series of solar wind plasma parameters and green coronal emission line intensity. The time series are keyed to times of maximum growth of explosively developing extratropical cyclones in the winter season. The new statistical evidence corroborates the previously published results (Prikryl et al., 2009). This evidence shows that explosive extratropical cyclones tend to occur after arrivals of solar wind disturbances such as high-speed solar wind streams from coronal holes when large amplitude magneto-hydrodynamic waves couple to the magnetosphere-ionosphere system. These MHD waves modulate Joule heating and/or Lorentz forcing of the high-latitude thermosphere generating medium-scale atmospheric gravity waves that propagate energy upward and downward from auroral zone through the atmosphere. At the tropospheric level, in spite of significantly reduced amplitudes, these gravity waves can provide a lift of unstable air to release the moist symmetric instability thus initiating slantwise convection and forming cloud/precipitation bands. The release of latent heat is known to provide energy for rapid development and intensification of extratropical cyclones.
But they haven’t worked out the mechanism yet. No mention of ozone in this statement:
“in spite of significantly reduced amplitudes, these gravity waves can provide a lift of unstable air to release the moist symmetric instability thus initiating slantwise convection and forming cloud/precipitation bands. The release of latent heat is known to provide energy for rapid development and intensification of extratropical cyclones.”
LikeLike
This article mentions ozone…. https://tallbloke.wordpress.com/2016/05/23/nasa-led-study-looks-at-sea-ice-differences-at-earths-poles/
Maybe no surprise, coz I see your blogs have been reposted over there.
LikeLike
NASA has a strong interest in maintaining uncertainty about the climate.
“NASA uses the vantage point of space to increase our understanding of our home planet, improve lives and safeguard our future. NASA develops new ways to observe and study Earth’s interconnected natural systems with long-term data records. The agency freely shares this unique knowledge and works with institutions around the world to gain new insights into how our planet is changing.”
Its no accident that James Hansen headed it up in its growth phase. These guys wanted money, lots of it, so that their toy collection could grow.
But there is probably some matters of interest in their re-packing observations. The strength of the north westerly flow has increased as polar pressure has fallen having the effect of corralling the ice into a protective zone rather than having it wander away and melting into warmer waters.
Unfortunately they deny themselves the longer view that a study of atmospheric history affords.
LikeLike
Erl, the wave in the atmosphere is visible in the highest zone of the stratosphere.

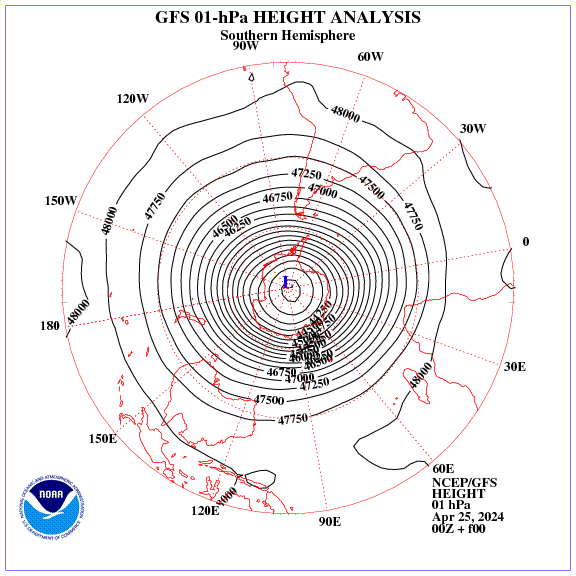
LikeLike
Ren, What is the definition of Wave 1?
LikeLike
erl happ says: May 23, 2016 at 10:37 pm
“Ren, What is the definition of Wave 1?”
Ren refused my question about ‘waves’ also! Where is the semi-periodic airmass motion that might constitute a ‘wave’? Does pressure variance with a cycle rate of 2 per month qualify as a sound wave?
Ren’s GDAS zonal mean “pressure” between 50° and 80° south latitude may have some meaning, but what? At a pressure altitude of 40Pa 50km what is the pressure variance tothe indicater 1km peak? Is that up or down? This seems to be another colourful cartoon produced by UCAR/NCAR that signifies nothing but instrument noise!
LikeLike
Will, Ren replied at 2016/05/24 at 12:22 am and the answer was authentic. If you look at the article you will see that they are talking your language.
LikeLiked by 1 person
erl happ says: May 24, 2016 at 10:15 pm
“Will, Ren replied at 2016/05/24 at 12:22 am and the answer was authentic. If you look at the article you will see that they are talking your language.”
Intended insult acknowledged!! I am learning about you. Ren never even answered my questions @ Will Janoschka: May 20, 2016 at 7:15 pm and the 05/24 nonsense does not even try to answer such. It does not address your question either. Did you even try to read “the article”? I read it… threw up, then saved it for historical evidence. There is not one smidgin of anything ‘scientific’ there! All is continuing meteorological fantasy with a new phrase “Vortex dipole”. This fits well with other nonsense phrases like
‘geostrophic wind’ ‘potential temperature’, and isentropic surfaces! These are disjoint concatenation of scientific word each having precise scientific meaning in endeavor remote from meteorology. NCAR and the Climatastrophists turn such meaning on its head, then create something very smelly and quite obscene! Enough for now!
LikeLike
Its fluid dynamics Will. A highly abstracted world in which one tries to model the way in which stuff moves using mathematical equations. It’s incapable of incorporating the complexities that exist in the real world but people like Sir John Houghton who chaired the committees that wrote the first two IPCC reports loved it, wrote texts in mathematical language and believed that it represented reality. It represents the takeover of climatology by the mathematical modellers. Unfortunately, nobody has a clue what they are on about. Accordingly, they don’t get pulled up and reminded that the real world is different.
Meteorologists are different. They dont ask why. They simply develop ‘rules of thumb’that work some of the time and not others.
What I am doing here is asking THE IMPORTANT QUESTION …WHY?
LikeLike
erl happ says: May 25, 2016 at 7:34 am
“Its fluid dynamics Will. A highly abstracted world in which one tries to model the way in which stuff moves using mathematical equations. It’s incapable of incorporating the complexities that exist in the real world but people like Sir John Houghton”
I share your disdain for academic meteorologists, who brought us the fantasy of CAGW. This is not fluid dynamics, this is abstract computerized modelling of nonsense! Computerized fluid dynamics is an admitted deficient way of trying to gain some understanding of turbulent/laminar air flow. The results are ‘always’ verified by physical models (wind tunnels, rotating spheres).
“Meteorologists are different. They don’t ask why. They simply develop ‘rules of thumb’that work some of the time and not others.”
That is the domain of ‘weathermen’, a highly useful endeavour! Meteorology is a branch of the social sciences that centers on effective storytelling!
“What I am doing here is asking THE IMPORTANT QUESTION …WHY?”
How does introducing your fantasy about O3, differ from the fantasy about CO2, introduced by academic meteorology? This atmosphere remains turbulent, likely un-knowable!!
LikeLike
Good question Will and you must be the judge of that. All is fantasy. Some fantasies are more useful than others.
LikeLike
erl happ says: May 25, 2016 at 8:04 pm
“Good question Will and you must be the judge of that. All is fantasy. Some fantasies are more useful than others.”
All fantasies are good for the meteorologists. Fantasies make the best stories. As winemaker you likely learned much of wine making and grape growing. To be able to make wine, vs vinegar, is not fantasy, it is a skill, and very physical. Folk either buy your product, or they do not. Stories of wine-making generally do not help!
LikeLike
I found this bit very interesting too…
” But the temperature of the planet is set by the obliquity (tilt) of its axis, not by solar variability, and Earth’s obliquity is decreasing everyday at the fastest rate in forty thousand years (figure 9). Only once in the last million years have temperatures failed to fall with falling obliquity, but when this happened (during MIS 11, 400 kyr ago), 65°N summer insolation was very high, while now it is very low.”
So does projecting a cooler global temperature imply a larger latitudinal gradient, from equator to poles, or a smaller one? I surmise a smaller one because there is less drive to lose energy.
LikeLike
Its all a bit obscure when it comes to long cycles. In my view the equator to pole temperature gradient depends upon the speed of transfer of energy by the ocean and the atmosphere. As surface pressure has fallen over high southern latitudes over the last 100 years the pressure differential between the mid latitude high pressure cells and the lows on the margin of Antarctica has about doubled. So, the roaring forties, the furious fifties and the screaming sixties have accelerated accordingly. And these winds drive the ocean currents in the southern hemisphere.
Its a very different story in the northern hemisphere. Surface pressure has not fallen much at all.
Whether there is a lot of cloud above when the sun is closest to the Earth is very important. Global minimum in cloud is associated with northern summer. Currently, the Earth is furthest from the sun in June. That changes over time. Sometime in the future the sun will be closest in June and northern summer will be much warmer and southern summer considerably cooler. So, its not simple.
LikeLike
Erl, maybe this will help.
Abstract
Vortex dipoles provide a simple representation of localized atmospheric jets. Numerical simulations of a synoptic-scale dipole in surface potential temperature are considered in a rotating, stratified fluid with approximately uniform potential vorticity. Following an initial period of adjustment, the dipole propagates along a slightly curved trajectory at a nearly steady rate and with a nearly fixed structure for more than 50 days. Downstream from the jet maximum, the flow also contains smaller-scale, upward-propagating inertia–gravity waves that are embedded within and stationary relative to the dipole. The waves form elongated bows along the leading edge of the dipole. Consistent with propagation in horizontal deformation and vertical shear, the waves’ horizontal scale shrinks and the vertical slope varies as they approach the leading stagnation point in the dipole’s flow. Because the waves persist for tens of days despite explicit dissipation in the numerical model that would otherwise damp the waves on a time scale of a few hours, they must be inherent features of the dipole itself, rather than remnants of imbalances in the initial conditions. The wave amplitude varies with the strength of the dipole, with waves becoming obvious once the maximum vertical vorticity in the dipole is roughly half the Coriolis parameter. Possible mechanisms for the wave generation are spontaneous wave emission and the instability of the underlying balanced dipole.
http://journals.ametsoc.org/doi/full/10.1175/2007JAS2351.1
LikeLike
Yes Ren, this is the answer that mathematicians give. But they know very little of the forces at work in the atmosphere. They necessarily work in a simplified world. They start with the assumption that the climate system is free of external forces and all phenomena of interest arise naturally as a consequence of the temperature gradient between the equator and the poles.
There are phenomena in the atmosphere that they struggle to explain. Did you notice this comment at the start of the article? “This article included in the Spontaneous Imbalance special collection.”
Notice the second paragraph: “Prominent inertia–gravity waves are often found beneath the downstream portion, or exit region, of localized upper-tropospheric jets (see the review by Uccellini and Koch 1987). Upward-propagating waves can also appear with a similar relation to the wind speed maximum, but in the stratosphere, above the tropospheric jet (e.g., Guest et al. 2000; Plougonven and Teitelbaum 2003). While the source of these observed waves is not yet settled, one possibility is that they arise spontaneously from the larger-scale jet. We examine that possibility in the present paper using numerical simulations of a dipole vortex in a rotating, stratified fluid. Because it possesses a localized jet between the two counter-rotating constituent vortices, the dipole vortex is a natural idealization of atmospheric “jet streaks” (Houghton et al. 1981; Van Tuyl and Young 1982; Cunningham and Keyser 2004).”
The words to notice are: ‘While the source of these observed waves is not yet settled,’
In plain language I think they are mesmerically observing the meanderings of the polar front. This can be analysed in terms of departures from the normal pattern of geopotential height. Now, GPH simply reflects the temperature of the atmosphere below the pressure level. In high latitudes temperature is very much a function of the ozone content of the air. And the ozone content of the air varies on all time scales…….because the system is not free of external forces. There is that interfering flow from the mesosphere, strongest in winter.
If these guys got out of their glass boxes into the real world they would find that temperature at the surface of the planet varies most strongly in the middle of winter when that mesospheric flow is strongest. And it varies. Think about this simple proposition. You can not turn a light off until it is on. What enables that mesospheric flow is high surface pressure over the pole. Then ask: What determines surface pressure over the pole?
LikeLike
erl happ says: May 24, 2016 at 5:47 am
“Then ask: What determines surface pressure over the pole?”
But who to ask? Any aeronautical engineer with a few years experience would remark the continual intense downward air-mass motion at the poles MUST create a static slightly elevated surface pressure potential to divert the down-welling air-mass. This deflects that air-mass in the direction of the equator! There simply is no other direction to go! Although aerodynamics specialize in the interaction of static air with moving surfaces, moving air-mass interacting with static surfaces MUST obey the same principles of fluid dynamics of a compressible fluid, and the inescapable continuum mechanics, ( MOVING MASS DON LIKE RIGHT ANGLE TURNS)!
LikeLiked by 1 person
Will, coriolis motions, air not turning at right angles, air moving from high to low pressure cells….none of it is relevant. Nor is the continuous downward air motion create the sort of pressure we observe over the Antarctic continent in winter reaching a pronounced planetary maximum.
Surface pressure over the winter pole is first of all a function of the extent of heating in the summer hemisphere and cooling in the winter hemisphere. So, it follows the gas law.
That comment was not intended as an insult. Its a wake up call. Ozone absorbs long wave energy from Sun and Earth but that available from the Earth dominates….especially when the sun is below the horizon. In doing so it changes the temperature of the air. Because its very unequally distributed in both the vertical and the horizontal, importantly the horizontal, it gives rise to a movement of the air. This is not meteorology because meteorologists and climatologists have not actually worked this out yet.
If the amount of ozone increases in high latitudes the air warms and the number of molecules in the column decreases. In the reverse, pressure increases at high latitudes.
LikeLike
erl happ says: May 25, 2016 at 7:10 am
“Will, coriolis motions, air not turning at right angles, air moving from high to low pressure cells….none of it is relevant. Nor is the continuous downward air motion create the sort of pressure we observe over the Antarctic continent in winter reaching a pronounced planetary maximum.”
#1 Polar static pressure rarely is higher than 34 Pa above The 101,325Pa sea level average pressure. A difference of about 0.3%. This is slightly higher than the static surface highs at 30° latitude, because the down-welling air-mass has high downward momentum (mv) or pressure (mv/m^2). This is because of both higher density from the lower temperature, but also much higher velocity from the much smaller surface area at the poles than from where that air was mechanically convected upward near 60° latitude. Get out a desk globe and look!
#2 Coriolis motion or effect is but a meteorological diversion to prevent understanding! Meteorology refuses to admit that Earth’s surface is not flat or that the Earth is rotating. Their POV is that the Sun cycles from one side of Earth’s surface to the other on a 24 hr basis. This atmosphere is in no way connected to Earth’s surface above 100m AGL. This atmosphere at all points retains its own local momentum (coherent mv) that requires an external force to change (one of Newton’s Laws).
#3 At the Surface near the equator surface roughness and shear forces impart an eastward tangential velocity near 1000MPH (450m/s) and a nominal width of 1500 km (low pressure equatorial doldrums) or ITCZ. In a rotating cylindrical coordinate system, this tangential velocity can be split into two orthogonal components (the outward radial), and the east-ward rotational or angular, each with its own momentum that must vector sum to the original momentum without additional external force. These external forces are everywhere and in every direction. For partial understanding, please put these other forces on the shelve in plain view for later consideration.
#4 Near the equator a balloon maintaining neutral buoyancy throughout ascent released from the surface outside the ITCZ with still some tradewinds appears to go upward and west-ward, equator-ward.
Once inside the ITCZ at an altitude of 4 km. this puppy is traveling outward at 100MPH (45m/s) and still appears to be going slowly westward. This is the upward/outward leg of the Hadley convection/circulation cell, with its downward/inward leg at approximately 30° latitude, 3000km away. That cell is a 100:1 squished, twisty circle of convection. At about the local tropopause that balloon must start to travel toward either pole depending on some of those obvious but still on the shelf external forces.
Please do not believe me on any of this! It is all carefully written in aerodynamics and aeronautics handbooks. It is the reason that aircraft do not fly through those puffy equatorial clouds at 5-6km and survive.
“Surface pressure over the winter pole is first of all a function of the extent of heating in the summer hemisphere and cooling in the winter hemisphere. So, it follows the gas law.”
Everygas follows the gas law whether you like it or not! Polar pressure is as I have described. Your fictitious function is immeasurable!
“That comment was not intended as an insult. Its a wake up call. Ozone absorbs long wave energy from Sun and Earth but that available from the Earth dominates….especially when the sun is below the horizon. In doing so it changes the temperature of the air. Because its very unequally distributed in both the vertical and the horizontal, importantly the horizontal, it gives rise to a movement of the air. This is not meteorology because meteorologists and climatologists have not actually worked this out yet”
Your claim is a direct insult to all that has been painfully learned of electromagnetic radiative flux. What you claim, physically cannot happen! Earth’s surface radiative exit flux does not now, nor ever has, increased the temperature of any part of Earth’s atmosphere. There is simply not sufficient surface exit flux to do that! The claim that a surface radiates proportional to its own T^4 is simply preposterous nonsense. Get any text on EMR published prior to 1965 and read for some learning! No one at all understands the relativistic. EMR is the most relativistic of all concepts, the only one that actually achieves the speed of light.
erl happ says: May 25, 2016 at 7:20 am
“Will, less passion and a more conscious attempt to explain the detail of what you believe might help me to understand what you are on about. Look at this as problem solving activity rather than whatever it is that you currently think it represents. Adopt the attitude of a teacher. Try to encourage the learner, not dismay him.”
Please read the above! Point out where I have attempted to dismay rather than explain? I remain in a quandary about “Does Erl want to learn?’ or ‘Am I only suffering fools?’
LikeLike
Sorry Will, cant agree. The atmosphere has a history that must be explained. None of the stuff you are talking about assists to understand the history. The manner in which the Earth warms is very particular. None of the stuff you are talking about gets to first base in explaining the way in which the planet warms. Open up your mind by reading this: http://www.atmos.colostate.edu/~davet/ao/introduction.html
LikeLike
erl happ says: May 26, 2016 at 7:55 pm
“Sorry Will, cant agree. The atmosphere has a history that must be explained. None of the stuff you are talking about assists to understand the history. The manner in which the Earth warms is very particular. None of the stuff you are talking about gets to first base in explaining the way in which the planet warms.”
The verb “warms” colloquially can mean increase in temperature or the application of more sensible heat!. The application of more sensible heat to already boiling water never increases temperature, but only the rate of boiling. Scienterrifically, The noun temperature, or its value can be an expression of potential for ‘work’ or ‘action’, or the expression of the result of such ‘work’ or ‘action’. Today the word ‘temperature or the word ‘warming’ is only used as ploys to steal your money never an expression of potential or its result.
“Open up your mind by reading this: http://www.atmos.colostate.edu/~davet/ao/introduction.html”
Never ever Erl! I refuse to accept even one word, phrase, sentence, paragraph, section, chapter, or work from UCAR/NCAR, even the punctuation is highly suspect!
LikeLike
I appreciate the humour in relation to the punctuation. But its not actually that mob at all. It follows on from the work of James Wallace, one of the greats in modern climate science.
I appreciate your distinctions in relation to the use of the word ‘warms’. It the atmosphere a parcel of air that warms differentially can not maintain its altitude. So, its shorthand for activity, the movement of the air from one place to the other. So, rest assured, when I say the air warms, I am talking about the origins of the movement in the air.
LikeLike
erl happ says: May 26, 2016 at 10:25 pm
“I appreciate the humour in relation to the punctuation. But its not actually that mob at all. It follows on from the work of James Wallace, one of the greats in modern climate science.”
Ah! An Erl that has “greats in modern climate science.” rather than’ principals in modern climate scams’.
“I appreciate your distinctions in relation to the use of the word ‘warms’. It the atmosphere a parcel of air that warms differentially can not maintain its altitude. So, its shorthand for activity, the movement of the air from one place to the other. So, rest assured, when I say the air warms, I am talking about the origins of the movement in the air.”
Would you please precisely define your meaning of verb ‘warm’ or to warm”? There are absolutely no atmospheric ‘parcels of air’. All must remain a continuum! You continue to appear as a warmist troll with no attempt to learn what is, or even what may be!…. Why God must I suffer fools?
LikeLike
Wow, beyond me. So as a chemist I see this thread distilling down to the ideal gas law. PV=nRT. I know not everything is ideal at low temperatures and that comes into play given the altitudes currently of interest. Anyhow, the simple equation seems to explain a lot about why matter moves around and the temperature it holds. Reactions, such as ozone / nitroxides, are included in this because it changes n. Sure….I am being simplistic but baby steps!
LikeLike
Macha says: May 24, 2016 at 5:07 am
“Wow, beyond me. So as a chemist I see this thread distilling down to the ideal gas law. PV=nRT. I know not everything is ideal at low temperatures and that comes into play given the altitudes currently of interest. Anyhow, the simple equation seems to explain a lot about why matter moves around and the temperature it holds. Reactions, such as ozone / nitroxides, are included in this because it changes n. Sure….I am being simplistic but baby steps!”
Let me try again. Your PV=nRT. is a version of the Ideal Gas law PV=NkT where the Nk gets replaced by n (moles) and R, (Avogadro’s number x k) plus weird crap of degrees of freedom and the ‘falsified equipartition theorem’. Ideal gas Law, ….”The pressure of a volume of ‘a’ gas is precisely proportional to the numeric gas molecules within that volume times absolute temperature times Boltzmann’s constant (k). Notice I did not use the dreaded = sign. That = sign contains all the weird crap of degrees of freedom and the ‘falsified equipartition theorem’.. Without the nonsense, the relationship of the triplet of pressure, numeric density, and temperature of the gravitationally ‘compressed’ atmosphere can be derived never once involving the mass of that atmosphere. Without further proof this demands that gravitational ‘mass’ be independent of inertial ‘mass’! The amount to learn of this atmosphere remains boundless!
LikeLike
Will, that’s impressive. A lot more than I know. I come from a simpler place.
I would appreciate your point of view on these two chapters that will let you in to where I am coming from.
https://reality348.wordpress.com/2016/01/13/7-surface-temperature-evolves-differently-according-to-latitude/
https://reality348.wordpress.com/2016/01/15/8-volatility-in-temperature/
LikeLike
erl happ says: May 26, 2016 at 9:44 pm
Will, that’s impressive. A lot more than I know. I come from a simpler place.
“I would appreciate your point of view on these two chapters that will let you in to where I am coming from. https://reality348.wordpress.com/2016/01/13/7-surface-temperature-evolves-differently-according-to-latitude/ https://reality348.wordpress.com/2016/01/15/8-volatility-in-temperature/”
No ErI I refuse to engage in your nonsense. You claim impressive, I claim only a minor conjecture (mine), that must involve many years of deliberation to establish or reject! I remain quite receptive to learned response that “I are likely totally full of shit!”!! I have done this before!
LikeLike
Hi Will, Not sure what you are referring to when you say ‘I have done this before’.
Here is a brief summation of my position for you. Perhaps what follows is not too much for you to read. Its a reply to a question that I gave elsewhere:
Clive, you ask how ozone drives the jet stream.
The movement of the air is a response to differences in atmospheric density that is reflected in surface pressure.
The greatest variations in atmospheric density actually manifest not at the surface but in the region of the tropopause. To be accurate, its in a broad region between 7km in elevation and 20 km in elevation. That is where we find the Jet Stream.
Why is it so that the largest differences in density manifest at this level?
Gordon Dobson observed back in the 1920s, as others had done before him that ozone maps surface pressure. It is the upper half of the atmospheric column that contains most of the ozone.
Ozone absorbs some of the abundant radiation that emanates from the Earth itself at 9-11 um and imparts that energy to surrounding molecules. The greater the atmospheric density the more efficient is the process. So ozone heats the air more efficiently near the surface than it does aloft.
It is the cold dense air of higher latitudes that has the greatest total column ozone giving rise to the lowest atmospheric pressure.
It is the warm, less dense air of the mid and low latitudes that has the least ozone aloft. So, here surface pressure is higher.
It is apparent that the circulation of the air about low and high pressure cells is a direct product of the ozone content of the air aloft.
It is observed that the surface warms when geopotential height increases at 500hPa or 250hPa. GPH directly reflects the temperature of the air below a given pressure level. Ozone contributes to the temperature of the air as it descends in high pressure cells. If the partial pressure of ozone changes in high latitudes it changes across the globe because at high latitudes ozone drives uplift. What goes up must come down. There are extremely vigorous winds in the stratosphere that vary in direction according to altitude. Hence the ability of Google to guide balloons about the globe.
The moisture level in the upper atmosphere changes very little but the temperature of the air changes a lot. And so therefore does cloud cover.
If you look to what drives the planetary winds it is the interchange of atmospheric mass between high and other latitudes. This is known as the annular modes phenomenon (colloquially the Arctic Oscillation). It is the strength of polar cyclone activity that is generated at the polar front, ozone rich air on one side and ozone poor on the other, that drives the generation of these cyclones. They propagate downwards from the jet stream altitude.If these cyclones strengthen they shift atmospheric mass from the poles to lower latitudes and into the summer hemisphere.
LikeLike
erl happ says: May 27, 2016 at 5:09 am
“Hi Will, Not sure what you are referring to when you say ‘I have done this before’.
Here is a brief summation of my position for you. Perhaps what follows is not too much for you to read. Its a reply to a question that I gave elsewhere:”
Someone somewhere is truly pulling your leg!!! Atmospheric O3 ranges from 0.0 to 0.07 PPM or a maximum ratio of 70 Ozone per billion other atmospheric molecules. the specific heat of Ozone is 0.6 of air itself. Eeven if the O3 molecules reached 1000K at creation by electric discharge or insolation, the increase in air temperature would be less than (4/1,000,000) of a degree Celsius! Nuff said!!
Before all else check the physical parameters of whoever is doing the spouting!
LikeLike
Will, you are denying the existence of the tropopause and the stratosphere. What planet did you say you were from?
LikeLike
erl happ says: May 28, 2016 at 8:27 am
“Will, you are denying the existence of the tropopause and the stratosphere. What planet did you say you were from?”
I have not above, nor have I denied anything! Please point out one defensible technical error in what I write! You on the other hand, by your continual promotion of the physically impossible, seem to deny that there are understandable ways of verifying the outlandish claims of meteorology, or other young PHD candidates trying to get their nonsense thesis approved and published.
If I wrote a nice paper claiming that you should purchase a commercial ozone generator to replace your wine bottling CO2 with O3, would you run right out and buy one, or would you carefully check first?
LikeLike
Sorry Will, I can’t see what you are on about.
LikeLike
erl happ says: May 28, 2016 at 9:04 pm
“Sorry Will, I can’t see what you are on about.”
Nor I with you! You seem only an old fart that spouts of ‘angle’ of roaches running across sheet that I am dying under!
LikeLike
Macha. Don’t be obscure, spell it out. Some of us are maths limited.
LikeLike
Sorry it appeared that way.
LikeLiked by 1 person
Macha, I don’t think its being simplistic at all. Its the behaviour of gases that we are concerned with and at a given pressure temperature and density are inversely related. Ozone is an energy gathering molecule that heats the other molecules about it. The heating process is assisted if the ‘other molecules’ are close by so it is a function of pressure. It heats more efficiently at low elevations than high elevations. Its very unequally distributed. So, that makes wind. All this occurs between about 7km and 20km in elevation. Low pressure cells have cold air at the surface but more ozone aloft so there are more molecules in the atmospheric column.
As a winemaker I deal with the behaviour of gases all the time. Fermentation generates CO2 and heat. The pressure generated, unless its released continuously will blow the container like a bomb. When ferment finishes I have to keep the product away from air. So, I use CO2 that is 2.5 times as heavy as air and relying on gravity introduce it at the surface of the wine and lift the air out. I measure the O2 content as the air exhausts. When wine comes back from barrel it has no CO2 left and put back in a tank with CO2 on top it will absorb the CO2 and suck the tank in…..not a pretty sight. Before the wine goes to bottle I can adjust its CO2 content by bubbling in nitrogen to replace some of that CO2. If a wine has gas above it that gas expands during the day and contracts overnight. If you put a breather on the tank you soon have air on top of the wine…..in a day there is enough O2 to promote acetification, the process whereby aceto-bacteria convert wine to vinegar.
LikeLike
Macha says: May 24, 2016 at 5:07 am
“Wow, beyond me. So as a chemist I see this thread distilling down to the ideal gas law. PV=nRT.”
That is extremely close!! Consider your ideal gas volume only constrained by Earth’s compressive gravitational field This is gas in a bottle! The only physical constraint of the bottle is “inside” the gas, Earth’s surface! Carefully use your ideal gas law to determine the static (attractor) of the triplet
concerning pressure, density, temperature, in the locations of such ideal gas. Such is very important for understanding.
On This Earth, the singular direction of intense insolation, plus the rotation of Earth with respect to the direction of that insolation, means that there can be no static, only the dynamic. This is only the weeping part of what is! To get down to true despair, one must consider that the folk hired to construct this Earth are not finished ‘tweeking’ it a bit more! The damn thing did not meet specifications!
Macha says: May 24, 2016 at 11:17 pm
“Sorry it appeared that way.”
Which way?
LikeLike
Will, less passion and a more conscious attempt to explain the detail of what you believe might help me to understand what you are on about.
Look at this as problem solving activity rather than whatever it is that you currently think it represents. Adopt the attitude of a teacher. Try to encourage the learner, not dismay him.
LikeLike
Erl, I agree with you that the origin of gravitational waves in the stratosphere and mesosphere is not explained. At the same time significantly affect the state of the polar vortex. When I say “polar vortex” I mean of course the winter.
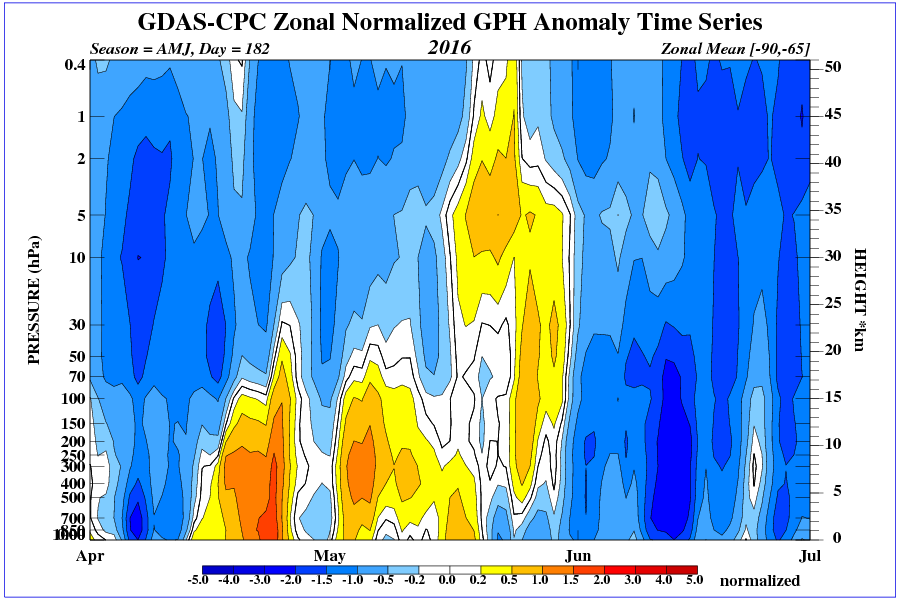
The current strength of the solar wind drops again. Can be clearly seen wave.
http://cosmicrays.oulu.fi/webform/query.cgi?startday=23&startmonth=04&startyear=2016&starttime=00%3A00&endday=23&endmonth=05&endyear=2016&endtime=00%3A00&resolution=Automatic+choice&picture=on
LikeLike
Ren, This: http://www.cpc.ncep.noaa.gov/products/stratosphere/strat-trop/gif_files/time_pres_HGT_ANOM_AMJ_SH_2016.png
Is just a more complete version of the AAO index. It shows the warmth aloft. When the air descends strongly from the mesosphere ozone rich air descends towards the surface and the air warms in the lower half of the atmosphere rather than the upper half that gets cooler. Warming aloft shows an accumulation of ozone in part due to an episode of accelerated convection. But the ozone aloft mixes into vortex air, warming it and slowing the downward circulation. So, the zonal wind slows down. That’s useful. Better than the AAO index.
LikeLike
Another strong wave is already visible in the upper stratosphere over the Indian Ocean.
https://earth.nullschool.net/#current/wind/isobaric/10hPa/orthographic=-293.43,-37.15,396
LikeLike
Ren, that looks like an ascending column of ozone to me coming from a couple of warm spots in the circulation at 70hPa. A lot of ozone at those positions ascending to the top of the atmosphere and here is the result: https://i2.wp.com/reality348.files.wordpress.com/2016/05/ozone-at-1hpa.jpg?ssl=1&w=450http://macc.aeronomie.be/4_NRT_products/5_Browse_plots/1_Snapshot_maps/index.php?src=MACC_o-suite&l=TC
LikeLike
Ren. A view of a planetary wave at 1hPa in terms of the ozone content of the air. https://i0.wp.com/reality348.files.wordpress.com/2016/05/planetary-wave-1.jpg?ssl=1&w=450
The part of the Pacific Ocean between Antarctica and New Zealand tends to low surface pressure (the lee side of all the continents in in spring and summer). Once initiated an ascending circulation sucks in ozone and drives it to the top of the atmosphere at 1hPa. If the vortex of mesospheric air over the pole waxes and wanes in its activity over time so too will the ozone content of the air circulating on its perimeter. As the ozone content increases generally it promotes the ascending circulation in the vicinity of New Zealand. In this way low pressure cells can become ‘sticky’ persisting in particular locations despite the constant west to east movement of the atmosphere. Ozone accumulating at the top of the atmospheric column will move to areas of descent. What goes up must come down. Data from here: http://macc.aeronomie.be/4_NRT_products/5_Browse_plots/1_Snapshot_maps/index.php?src=MACC_o-suite&l=TC Check it out at 50hPa. There is no such variation as is seen at 1hPa. In terms of the wave maps you look at the same information is presented as Geopotential Height Anomalies. GPH and ozone are hand in glove because ozone warms the air…….but Will doesn’t know that and you should not tell him.
LikeLike
Visible effect of circulating 10 hPa on 70 hPa circulation.
https://earth.nullschool.net/#current/wind/isobaric/10hPa/orthographic=111.72,-51.54,396
https://earth.nullschool.net/#current/wind/isobaric/70hPa/orthographic=111.72,-51.54,396
LikeLike
Ren. Hot air is less dense. It will be rising strongly at the 70hPa level. Think of a chimney. 70hPa is at 17km in elevation and there is 7% of the atmosphere above that level. 10hPa is at 30km elevation. There is only 1% of the atmosphere above that level. The Null school diagram shows the circulation in the horizontal. It has a vertical component that we can only imagine. By the time it gets to 10hPa the air is less dense. If it rises at one point an equal amount of air must descend somewhere else. But that air will descend slowly over large areas and give off energy to space all the time but because its ozone rich it will gather energy. So it will warm not only due to compression but also because it has ozone within.
LikeLike