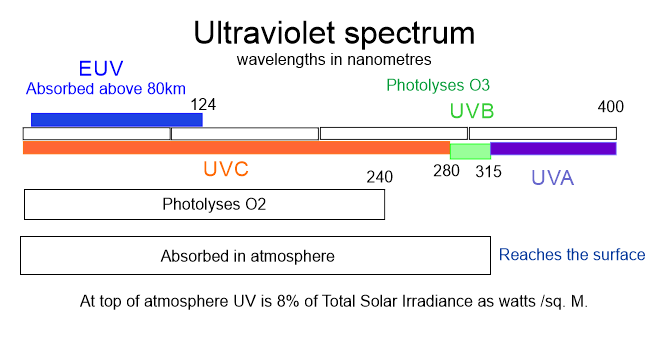
Chapter 25 established that, in low latitudes, the stratosphere below about 40 kilometres in elevation is a relatively safe environment for ozone. All the extreme ultra-violet and X ray radiation that is responsible for the ionosphere is used up above 60 km in elevation. Below 40 kilometres in elevation ozone partial pressure builds during daylight hours indicating a relatively safe environment for what is admittedly a tiny amount of ozone in air that is in any case extremely rarefied.
To resist photolysis in the stratosphere the ozone molecule must avoid radiation in the UVB and shorter spectrum. At any other than near vertical sun angles the atmospheric path is too long to allow much UVB to reach the surface but the small amount of ozone in the stratosphere creates what is in fact just a very coarse sieve. If you had such a sieve in the kitchen some of the spaghetti would leak through with the water when you drain the water off. The population of runners (ionising radiation) is small and the obstacles (ozone) are widely spaced.
As the sun sinks towards the horizon in winter, ozone proliferates.This, and the ability of the ozone molecule to absorb infra-red emanating from the Earth is the reason why the upper stratosphere at 1 hPa is warmer over the poles than at the equator in summer despite the very low angle of the sun and very little cooler in winter when the sun is below the horizon. It is not ionising radiation that heats the stratosphere, it is ozone absorbing long wave infrared from the Earth.
The existence of a tropopause in high latitudes during the polar night when there is patently no short wave radiation to be had, testifies to the importance of the status of ozone as a agent for heating the air via absorption of outgoing infrared. The notion that the temperature of the stratosphere is determined by the absorption of short wave radiation from the sun is universally accepted and promoted because it suits a certain narrative but it is nonetheless false. Above the mesopause yes, below the mesopause no. The mesopause marks the point where the ionosphere begins.
In the southern hemisphere the polar night prevails between March and September. See the sonde data below. Note the inflection in the temperature curve at the elevation where the partial pressure of ozone increases, at some 9 kilometres above the surface, plainly due to ozone heating. The fall in the temperature of the air above 12 kilometres in elevation is due to the descent of very cold air from the mesosphere. That air is relatively ozone rich by comparison with air that arrives laterally from the region of the very cold tropical tropopause that is always ozone poor. Some intruding tongues of ozone poor air are evident, especially at 15 kilometres in elevation.There is a great deal of horizontal movement of the air in the stratosphere, in fact just above the tropopause, more than anywhere else. The failure to recognise the importance of that movement and its origins has been fatal for climate science. The ‘annular modes phenomenon’ is inexplicable without an understanding of the dynamics at work in the stratosphere.

In this stratospheric ‘safe environment’ for ozone one might expect that the ozone content of the atmosphere would increase in direct response to the length of the atmospheric path.In the absence of any other control mechanism ozone partial pressure should peak at the surface of the planet and attain its highest partial pressure over the poles. Alas, there are, at a minimum, two other control mechanisms at work. One is NOx emanating from the surface of the planet. The second is via the influx of ozone starved mesospheric air at the winter pole. The rate of influx at the pole depends upon surface pressure that is in turn dependent non the collective activity of polar cyclones that surround the pole.
Ozone partial pressure in high latitudes may build under the impact of cosmic radiation. This activity is modulated by the temperature of the air over the pole and the incidence of cosmic rays is modulated by the solar cycle and the solar wind that is to some extent independent of the sunspot cycle. Since there is no apparent cycle in atmospheric pressure over the Antarctic pole that is in tune with the solar cycle the cosmic ray effect must be small, at least at solar cycle intervals. Nevertheless cosmic rays are much more in evidence at solar minimum and it is possible that their ozone production capacity becomes a factor of increasing importance in promoting short term shifts in atmospheric mass during periods of very low solar activity.
CHEMICAL EROSION OF OZONE BY NOx
NOx is produced by fossil fuel combustion, biomass burning, decomposition in soils and lightning. NOx is a generic term for the mono oxides of nitrogen NO and N2O. Both are active in the catalytic destruction of ozone. The lifetime of these compounds increases with elevation so that they are more potent at 10 km elevation than at the surface.
Below we compare the global distribution of NOx with that of ozone at 100 hPa. Source:http://macc.aeronomie.be/4_NRT_products/5_Browse_plots/1_Snapshot_maps/index.php?src=MACC_o-suite&l=TC
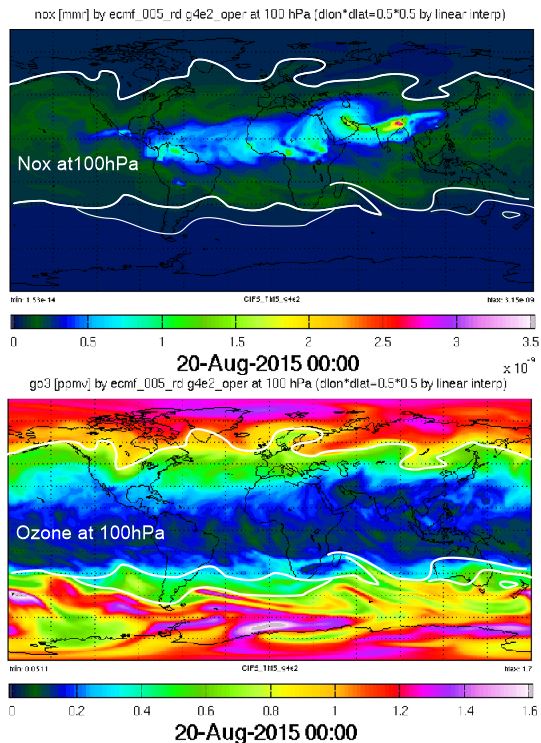
It is evident that in equatorial latitudes, where NOx is most abundant, ozone is almost completely depleted. The patterns created by air of different NOx concentration reveal the movement of the atmosphere at 100 hPa. For the purpose of comparing the two diagrams a white line traces the edge of apparent NOx presence and this line is applied to the ozone diagram taking care to match the latitudes correctly. The two fit like a glove. Notice that it takes only trace levels of NOx in the ozone deficient southern hemisphere to produce a marked depletion in the ozone content of the air in the mid latitudes. Although it is not apparent in the NOx content of higher latitudes in the southern hemisphere the pattern of depletion of ozone in the southern hemisphere suggests that the influence of NOx extends all the way to the southern pole. This should be no surprise given the role of NOx in producing the Antarctic ‘ozone hole’ at the time of the final warming of the Antarctic stratosphere between September and November as described in chapter 23. Here we are seeing the precursor environment for the Antarctic ozone hole in spring.
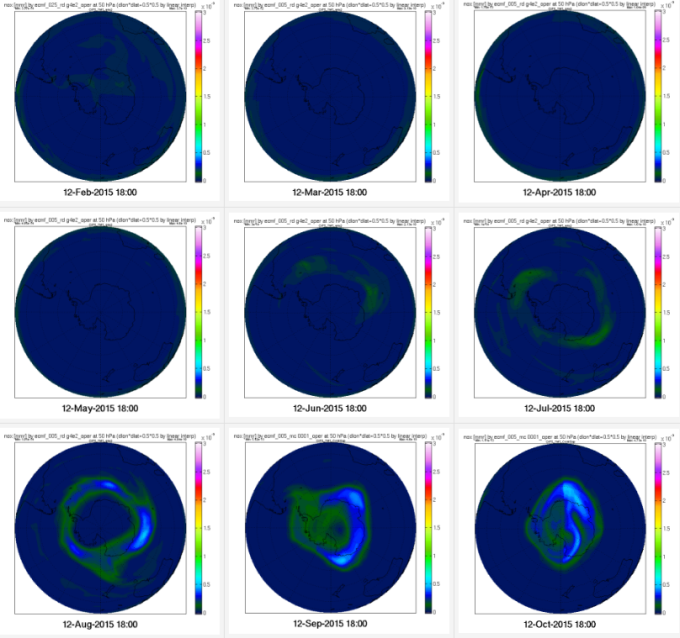
Below, at the 50 hPa pressure level, an elevation of 20 kilometres, is mapped the distribution of NOx in the southern hemisphere on the 12th day of the month between February and October 2015.
Notice the camera iris like structure of the developing Antarctic Ozone hole.
Below, and again from a polar cap perspective, this time centred on the month of April, we have nine months of single day data for NOx in the northern hemisphere at 50 hPa. Notice the strong presence of NOx at 50 hPa, much stronger than in the southern hemisphere. Notice the camera iris structure that appears on 12th March and its displacement off the pole a month later. Yes, there is an ozone hole in the northern hemisphere an artefact of the final warming when the descent of mesospheric air rapidly falls away due to swiftly rising surface pressure over the pole.

Below we see the distribution of NOx at 100 hPa in the northern hemisphere. The increase in atmospheric NOx that presses in from low latitudes to flood across the entire hemisphere is plainly a summer phenomenon. Notice the wave like structures representing a flow of cold NOx rich air towards higher latitudes.

Below we have the distribution of NOx in the southern hemisphere at 100 hPa from a polar cap perspective.
 The ocean dominant southern hemisphere is plainly less influenced by the presence of NOx at 100 hPa than is the northern hemisphere. Nevertheless there is NOx present at this level in October contributing to the Antarctic ozone hole in that year.

The distribution of NOx relates to the pattern of surface pressure because it arrives with very cold tropical air characterised by relatively high surface pressure. The wave like pattern of intrusions of NOx rich air from the tropics show up in ozone profiles as an ‘ozone hole’ above the point where we have a tropopause in high latitudes, about 8 kilometres in elevation. The diagram above reminds us that the air between 150 hPa and 50 hPa in the tropics is cooler than -70°C. It is cooler because of its low ozone content due to erosion by NOx.
On the basis of the diagrams above we can note:
- There is an appreciable presence of NOx at 50 hPa across the northern hemisphere from February through to August. This enhanced presence in the summer season is consistent with biomass burning and the processes of soil decomposition that are more active in summer.
- There is no parallel presence of NOx at 50hPa in the relatively land deficient southern hemisphere from July onward but there is the appearance of anomalously high concentrations of NOx around the entire globe at about 70° south latitude expanding inwards to occupy the entirety of the polar cap in September and October. This is the Antarctic Ozone hole, a natural feature of the Antarctic atmosphere, not a creation of man via the release of chlorofluorocarbons. That hole will wax and wane with change in atmospheric dynamics related to changing ozone partial pressure over time.
- It is not NOx emanating from below that is the root cause of the generalised ozone deficiency in the southern hemisphere. The only other source of ozone depletion in the southern hemisphere is via straight dilution by a very active polar vortex.
- High levels of NOx in the Arctic atmosphere manifest in March and April giving rise to the northern hemisphere equivalent of the Antarctic Ozone hole, briefly manifesting as part of the ‘final warming’ process but rapidly dissipated. It simply does not hold position due to the geography of land and sea. If the Arctic was a land mass surrounded by sea things would be different.
LATERAL INCURSIONS IN THE OZONE PROFILE
Summit Station is located on the Greenland Ice Shelf at 70° north latitude where the partial pressure of ozone attains a strong peak in winter. This location experiences wide fluctuations in the ozone content of the air according to the origin of the air travelling overhead. Incursions of mid latitude air can produce gaps in the ozone profile as seen below. Notice that the tropopause at this relatively high latitude is located at about 7 kilometres in elevation. The decline of temperature with altitude is reversed at 7 km where the ozone content of the air is a mere 3- 4 parts per million. The ability of ozone to transfer energy acquired by absorption in the infra-red is dependant on the ‘density of the molecular pack’ in a pass the parcel type situation. Notice that an increase in ozone partial pressure at the 50 hPa level is responsible for another small temperature advance. The atmosphere in high latitudes is never still in winter. The temperature of the air in the stratosphere is much influenced by the descent of mesospheric air from above that is being actively mixed into the profile as well as the air that arrives from lower latitudes. This pattern of movement is reflected in the meandering of the jet stream that is itself a product of steep gradients in ozone partial pressure, air temperature and density.

Below we have sonde data for ozone partial pressure at Summit Station between late January and September.
This diagram indicates what a localised, non polar, ozone hole can look like in terms of reduced ozone partial pressure. By September, as a product of the increase in the NOx content of the air in summer the ozone profile is extensively eroded below the 50 hPa pressure level (20 km in elevation) so as to establish an ozone maximum at 50 hPa rather than at 100 hPa (15 km) the level that prevails in winter.The green line that shows ozone partial pressure on 22nd April shows a twin peaks in ozone partial pressure due to a deep incursion of mid latitude air centred at an elevation of 15 km.
In the absence of incursions of mid and low latitude air, peak ozone partial pressure is established at 100 hPa or 15 kilometres in elevation.When NOx rich air arrives from low latitudes it is active in reducing ozone partial pressure primarily at and below the 50 hPa pressure level.
Notice the relative similarities in the ozone profile below about 7.5 km in elevation. The marked increase in the partial pressure of ozone above this level reverses the decline in atmospheric temperature with elevation creating the ‘tropopause’. Notice that the ‘tropopause’ in no sense marks a boundary between air that has ozone and air that does not. The tropopause is the interface between two types of air, one with NOx and one without NOx. It moves up and down with the seasons according to the presence or absence different sorts of air. The tropopause is a function of the chemistry that is introduced via different parcels of air with very different characteristics. Movement is induced by density differences in line with different ozone partial pressures. The patterns in the juxtaposition of different sorts of air masses is imposed by the west to east rotation of the atmosphere that is most active at the poles.
The diagram below shows the ozone profile at a number of different latitudes including near equatorial situations where the thickness of the near surface NOx rich layer is greatest.

Pago Pago and Suva exhibit peak ozone partial pressure at 33 kilometres in elevation. That is the thickness of the NOx rich layer. The thickness of the layer relates to the extent of convection in the tropical atmosphere. Water vapour is also antagonistic to the presence of ozone.
In general ozone is present throughout the atmospheric column even in the near surface atmosphere and is capable of warming the air via the absorption of infra-red radiation at any and all levels. In higher latitudes where the NOx carrying layer is thin ozone partial pressure rises from about 7 km in elevation strongly influencing the temperature of the air and its density. The lateral contrast in ozone and air density across the ‘vortex’ gives rise to the strongest winds except those seen in the upper stratosphere in the polar vortex itself. These winds are much stronger than anything that manifests at the surface of the planet except for tropical cyclones of the stronger variety. It should be plain that it the severe gradients in ozone partial pressure in the vicinity of the ‘tropopauses’ (and there can be many) that can establish at any elevation between 7 and 20 km that drives the circulation of the air rather than surface heating in the tropics.That is a ‘primitive’ notion that appears to be plausible. We only need to observe the jet streams to see that reality is otherwise.
NATURE OF THE OZONE PROFILE IN THE ATMOSPHERE
We can conceive of an ‘ozonosphere’ that begins at the mesopause and extends to the surface of the planet. The upper limit of the ozonosphere is the mesopause. At that point the pressure of ionisation of the ozone molecule eases to the degree necessary to allow a sufficient population of ozone molecules to amass so as to warm the atmosphere via the absorption of infra-red. Heating due to the ionisation process itself increases with elevation. It is for this reason that air temperature increases in the ionosphere and the thermosphere. The contribution to atmospheric heating due to the photolysis of ozone falls away as the atmospheric path lengthens and may be considered to be negligible at the tropopause and in higher elevations at higher latitudes.
Below the mesopause ozone partial pressure increases as the surface is approached and the pressure of ionisation falls away. It falls away due to the depletion of wave lengths shorter than 315 nm at the upper limit of the UVB part of the spectrum. The ozone content of the atmosphere is therefore in the fist instance a function of sun angle and the corresponding length of the atmospheric path to absorb short wave lengths a function of latitude markedly increasing in winter. Over the polar cap other dynamics come into play. Closer to the surface, yet other dynamics involving NOx come into play according to latitude. Then in springtime at the poles all three influences produce the curiosity of the ozone hole, an entirely natural circumstance associated with the collapse of the winter circulation as surface pressure at the poles rapidly falls away.
The descent of mesospheric air over the polar cap is required for geostrophic balance due to the continuous ascent of ozone warmed air via the ‘polar vortex’ a high speed cone like circulation that manifests from 100 hPa through to the 1 hPa on the margins of descending cold mesospheric air. There is the associated phenomenon whereby ozone tends to accumulate in zones of low surface pressure over the oceans in mid and high latitudes mushrooming towards the limits of the stratosphere on a periodic basis (a 9-10 day cycle) and at times displacing the vortex from its position of centrality over the pole. The northern vortex in early winter finds a conducive home over Siberia and East Asia rather than over the Arctic Ocean. These phenomena elevate ozone partial pressure at 10 hPa and higher giving rise to amplified variations in temperature over time. The temperature swings increase with increasing altitude as a consequence of convection. Meteorologists map this phenomenon as increased Geopotential Height. Climate theorists have become fond of the notion of ‘planetary waves’, 1, 2 and 3 that relate to the pattern of increase in geopotential height.That particular theory is gains credibility due to the inability to observe that ozone absorbs infrared and that this is the source of heating in the stratosphere. If one maintains that the stratosphere is heated by short wave radiation from the sun on an exclusive basis it is difficult to conceive that differences in ozone partial pressure could drive the global circulation of the air from high latitudes in the winter hemisphere.
CONCLUDING REMARKS
The current conceptions as to the nature of the troposphere and the stratosphere are at the root of our inability to understand the ongoing changes in surface climate.
It is the stability and strength of the southern vortex that accounts for the relatively low ozone content of the southern ozonosphere.
Mixing occurs across the vortex and in particular at upper and lower elevations modulating the ozone content of the air across the entire ozonosphere from the active winter pole but with greatest effect in the southern hemisphere.This is simply a matter of the distribution of land and sea.
Without the erosive activity of NOx e in the near surface atmosphere peak ozone partial pressure would be established at the surface of the planet. The ozone maximum at any pressure level is not a function of photolysis and recombination phenomena within an ‘ozone layer’ that establishes at some level within what we have come to call the ‘stratosphere’. Significant ionisation only manifests in the D layer of the ionosphere during daytime hours above 60 km in elevation. Below 60 km , the chief molecule that is ionised is ozone itself via the activity of UVB that is almost entirely used up in the process. It follows that the ozone content of the air increases with the length of the atmospheric path. The concept of an ‘ozone layer’ is a work of an imagination that is uninformed by observation.
In the near surface atmosphere NOx proliferates most strongly over land in the northern hemisphere. It actively depletes ozone and especially so in lower latitudes as a function of surface heating and the rate of evaporation near the equator.
The relatively high ozone content of the atmosphere in the northern hemisphere is due to the weakness and instability of the northern polar vortex. This in turn gives rise to marked variations in air temperature over the polar cap in winter (and only in winter). NOx actively sculpts ozone from below in the northern hemisphere but the weakness of the northern vortex ensures that ozone partial pressure is maintained at much higher levels in the northern hemisphere than prevails in the south.
In high latitudes, a very much lower ‘tropopause’ and therefore much enhanced ozone partial pressure aloft gives rise to very low surface pressure. The reverse is the case in low latitudes. Continuous heating of the atmospheric column in the tropics creates a very light low pressure zone of ascending air but this pales into insignificance when it is compared to the situation at 60-70° south latitude where Polar Cyclones propagate downwards from upper air troughs. The circulation of the lower atmosphere proceeds according to the pressure differentials that are so established. That circulation is the primary determinant of surface temperature impacting the equator to pole temperature gradient.
The most severe differences in local air density manifest across the vortex near the poles. Changes in this domain are more vigorous than elsewhere. Over extended time scales change in the Antarctic is enormous by comparison with the Arctic.
At any point on the Earths surface the synoptic situation changes on all time scales. The synoptic situation relates to the shape of the ozonosphere. Its shape is the product of influences from above, from below and also sideways. As the shape of the ozonosphere changes so does surface weather and climate.

Source http://journals.ametsoc.org/doi/pdf/10.1175/1520-0469(1967)024%3C0569:COTVDO%3E2.0.CO%3B2
Above we see ozone profiles at Albuquerque New Mexico at 35° north latitude reflecting day by day changes in the height of the tropopause and the ozone profile as air masses of tropical and polar origins pass by. It is apparent that change occurs predominantly in the medium that we have assumed to be be both stratified and quiescent. These changes that are the essence of the ‘synoptic situation’ gives rise to the nature of weather and climate on all time scales. Accordingly, the greatest changes in surface temperature occur in the middle of winter in line with the extreme flux in the ozone content of the air in that season.
Climatology has much to learn and unfortunately a lot to unlearn including the notion that the temperature at the surface is a matter of ‘radiative forcing’ by greenhouse gases. This notion is too simple by far.

Glad to see the chapters rolling out. I appreciate the massive investment to do this. Personally, I have come to the very same conclusion on thermal effects of ozone and UV although I must say I do not constrain myself to NOx as you appear to do here. I find All reactive halides will/should do the same to Ozone, eg. SOx, Cl, Br, CFCs. This omssion gave rise to my thoughts that your dismissal of the Manmade CFCs and Montreal protocol detracted from the main chapter theme, which for me, was about expousing what depletes ozone. There are other sources of halides. Eg Volcanoes are no different to manmade CFC production. BOTH are / were climatic events that happened and generate reactive halides. But I suppose thats not fishing one point at a time. Thanks for helping my journey. Great charts too.
LikeLike
Thanks Macha. I am not a chemist. I am aware that there are many interactions going on. Sure, man made chemicals have the potential to affect the ozone content of the atmosphere. But history and observation of the way in which the atmosphere responds in the course of the Earth’s rotation about the sun informs me that the same entirely natural forces that erode ozone near the surface are active in depleting ozone in a very localised zone in Antarctica in Spring. Sure, the temperature is cool enough for the generation of PSC. I trust the chemists to tell me what happens in a lab and am happy to accept all that is ridgy-didge. But I wouldn’t trust them to ascertain whether those things that they do in the lab are responsible for change in the other bigger lab where the variables in play are rather more numerous. And especially so when they will not acknowledge the importance of those dynamic interactions in the atmosphere generally. The hole was there before they woke up to its existence and blamed humanity and its likely to be more evident as polar surface pressure increases over the next 100 years.
These guys are assuring us that its mans work and its plainly not. I know that because the hole was measured by Dobson in 1956 or thereabouts long before the widespread use of refrigerants or propellants. Back in 1956 we relied on the Ice man and the Coolgardie Cooler. The Kelvinator was still to come. The increase in the ozone content of the southern atmosphere over the last sixty years has elevated the temperature of the air over the polar cap, intensified polar cyclone activity and has profoundly changed atmospheric dynamics with the greatest change in spring when that hole appears. In the social and atmospheric sciences we do not have the luxury of being able to conduct experiments where we vary one thing at a time in a controlled environment. So, we need to be cautious and these guys showed no caution, listened to nobody and went to the press and the court of public opinion. In my book they are ‘witch doctors’. Agenda driven ‘science’. They were pleasing their constituency.
When that hole manifests the ozone content of the air about the very restricted province of the hole is increasing. There is no correlation between the hole and the atmosphere outside the hole. The argument is pure bull.
LikeLike
They wanted a Nobel and they got it. So did Al Gore and the IPCC.
LikeLike
Macha: http://macc.aeronomie.be/4_NRT_products/5_Browse_plots/1_Snapshot_maps/index.php?src=MACC_o-suite&l=TC Select Bascoe. Centre on June 14th at monthly intervals. You can inspect the distribution of ClO, ClOx, H2O, HCl etc etc.
LikeLike
Currently, a large increase in the speed of the solar wind and a significant drop in the galactic radiation.
http://cosmicrays.oulu.fi/webform/query.cgi?startday=17&startmonth=05&startyear=2016&starttime=00%3A00&endday=17&endmonth=06&endyear=2016&endtime=00%3A00&resolution=Automatic+choice&picture=on
LikeLike
OK got it. Your suggestion is very helpful.
The Arctic is not susceptible to major warming (increase in geopotential height) at this time of the year because its not cold as it is in the winter. But there is a relationship between the neutron count and geopotential height over the polar cap as seen here. https://i2.wp.com/reality348.files.wordpress.com/2016/06/neutron-count-and-gph-anomaly.png?ssl=1&w=450
Specifically, a high neutron count is associated with the onset of a warming phase in the atmosphere. This relationship is actually well known although it may not be acknowledged or remarked on very much. However, the atmospheric response (in geopotential height) lags the neutron count suggesting that there is an ionisation process happening in the polar atmosphere caused by cosmic rays that is responsible for the production of ozone. The enhanced level of ozone is consistent with the increase in geopotential height.
There is a strong relationship between total column ozone and the circulation of the air at 200 hPa as seen in data for today 18th June 2016 here: https://i2.wp.com/reality348.files.wordpress.com/2016/06/tco-and-circulation-in-arctic.png?ssl=1&w=450
This unequivocally links the incidence of cosmic rays with the circulation of the atmosphere. Of course the incidence of cosmic rays depends on the solar wind as you well know. Thank you very much for your continued prodding. I have been looking for this link for many years and now I have it. I did not expect to find it in the summer in the Arctic. Its just a pity we don’t have neutron counts in the Antarctic.
Unfortunately, until there is recognition of the fact that the stratosphere is warmed by infrared from the Earth and not incoming short wave radiation this will remain a mystery to climate science. Without this site http://macc.aeronomie.be/4_NRT_products/5_Browse_plots/1_Snapshot_maps/index.php?src=MACC_o-suite&l=TC and the null school animation https://earth.nullschool.net/#current/wind/isobaric/250hPa/overlay=temp/orthographic=-359.77,90.69,367 this could not be established.
LikeLiked by 1 person
http://neutronm.bartol.udel.edu/~pyle/RTPlots.html
LikeLike
LikeLike
Thanks Ren that’s very useful. I have had a look at the data for the southern hemisphere comparing cosmic ray peaks with anomalous increases in GPH as Wave 1. I think that cosmic rays are making ozone but there is another factor involved that involves electromagnetism. There are times when GPH increases in line with the Kp index without any unusual cosmic ray activity. When the two act together the response is more sustained.
LikeLike
I followed the story until this bit…” stratosphere warmed by IR”…??.hmmmmm, Ok. maybe at night or during polar winters it can be a significant driver, but not by day. I realise my claim is just words ftom a mere chemist, so i will work to prove it to you but it might take me a while. Cheers.
LikeLike
Hi Macha, its getting too late at night for both of us. Infrared comes from the sun and also the Earth but the bulk of it from the Earth. Ozone absorbs at the 9-10um wave length where the energy coming from the Earth at and about that wave length is inexhaustible when you consider the amount of ozone that exists to absorb it. But absorb it ozone does, and that’s why people call it a ‘greenhouse gas’ along with CO2. As rapidly as ozone absorbs this energy it passes it on to N2 and O2 and anything else and grabs a bit more energy. The denser the atmosphere the easier the transfer is and the greater is the heating result.
The Earth at the poles gives up the small amount of energy that is transferred from warmer latitudes by the ocean and the atmosphere day and night regardless of whether it gets any daytime or not. The atmosphere also radiates. The only way that energy gets back to space is via radiation. Without it the oceans would soon boil away.
LikeLike
I have to put latest comment down to being near midnight. Claiming Sun IR arms earth, reflected earth IR then warms ozone, co2 and n2…etc. Which drives temperature. Wow. Thats amazing change of tune. how come no mention of Water, it trumps all greenhouse gases via phase changes, cooling from evaporation and warming from condensation ( cloud/ rain). An Led light will not warm much else around it, even if you have plenty of them. It might be visibly lighter but not much hotter. A few minutes of UV from sun in summer, esp. If down in Albany, will get you a nice dose of sunburn. You wont see IR doing that. Energy ma nifesting as temperature is about intensity not quantity. Ie two bodies at same temperature are not twice as hot because they come together. Vast oceans transport more heat via surface winds to surface air temps than IR, hence coastal areas not experiencing variations inland high/lows, yet both get same IR reflected from earth.
LikeLike
Hi Macha, “Amazing change of tune”. Not at all. Perhaps a change in your perception of what I am writing. Let me reiterate:
Energy from the sun is concentrated in the short wave spectrum. It heats the Earth’s surface that warms accordingly (a small amount reflected as surface and cloud albedo). The temperature at the surface determines the wave length that is emitted by the surface. That is in the infrared peaking at close to 9-10um. That infrared is capable of exciting lots of gases including water vapour, CO2, and ozone. Water vapour and ozone are not uniformly distributed. Water vapour is present more in the tropics. Ozone is present more in high latitudes. In my writings I look at the importance of ozone in determining the temperature and density of the air in high latitudes. Because of the marked difference in ozone partial pressure over short distances in both the vertical and the horizontal dimensions strong wind is generated.
High total ozone content in the atmospheric column correlates with a low tropopause and low surface pressure. Change ozone content and you change surface pressure. The thing that changes on all time scales that changes the climate is the difference between surface pressure between the mid latitudes and the poles.
The temperature of the stratosphere is due to ozone. There is virtually no water vapour present.
LikeLike
” The existence of the phenomenon whereby atmospheric mass shifts
over long time scales tells us that external influences are involved. ”
Erl, I’m so glad that you’ve got it right.
There are so many that believe that a 140 year cooling cycle is evidence
that the oceans take 70 years to heat up and that it would take another 70
years to gradually give up that heat. This is simply not true. When electro-
magnetism pulls the plug, the oceans will give up their heat.
After this inter-glacial there will be 90000 years in which the oceans will
struggle to store heat. And whether it’s 140 years or 90000 years, only an
outside force can make this happen and only an outside force can reverse
it.
LikeLike
Academia , or more accurately the ‘climate science’ subset took over the stage pushing all the other players aside. They wanted the power and influence. They wanted the money. Individuals picked up the odd Nobel. But none of this would have been possible unless the elites sought,sanctioned and financed it. That is where the real problem is. The elites don’t read climate texts. They don’t read blogs.
I see some hope with the vote in the UK to leave the EEC. Will there now be a tussle over ‘climate change’ policies? Does the UK need to be sensible about the cost of energy? Is Brexit about the desire to be competitive and retain industries that are power intensive? Is it about poorer people being able to keep warm in winter? Is it about rolling back the onerous influence of planners from local government levels upwards? There is a culture shift involved. It will take time. And it will take leadership. In a democracy 51% of the vote is sufficient. But people need someone to articulate what they want. A rallying point.
LikeLike
Reblogged this on Climate Collections.
LikeLike