CHANGE IN THE STRATOSPHERE
The strength of the meridional flow (north-south and south-north) in mid to high latitudes depends upon the distribution of atmospheric mass between the poles and the mid latitudes. That in turn rests on the strength of polar cyclone activity between 50 and 70 degrees of latitude in both hemispheres. Because these cyclones lift ozone rich air to the top of the atmosphere and will do so according to density differences wrought by ozone between 300 hPa and 50 hPa it follows that 10 hPa temperature over the pole is a proxy for the strength of polar cyclone activity. Another good proxy is surface atmospheric pressure. A third would be geopotential height, a fourth would be the strength of the zonal wind. In this chapter, for simplicity, we look at 10 hPa temperature over the poles.
We are looking at temperature at the top of the stratosphere as one product of the change in atmospheric processes.When this indicator changes we a seeing a change in the parameters of the climate system. We have not one climate system but many across a continuum. If you can’t chart the continuum or predict the course of the climate system within the continuum you can’t mathematically model it.
We notice:
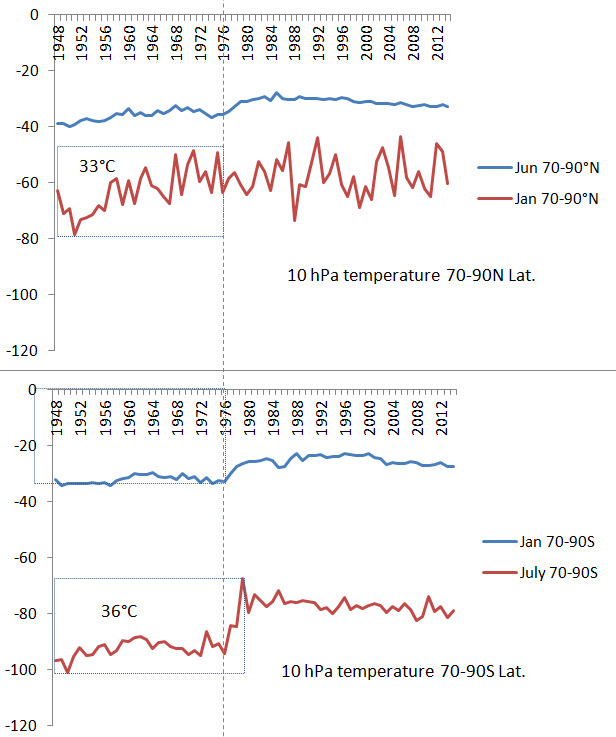
- 10 hPa temperature varies more in winter and particularly so in the Arctic.
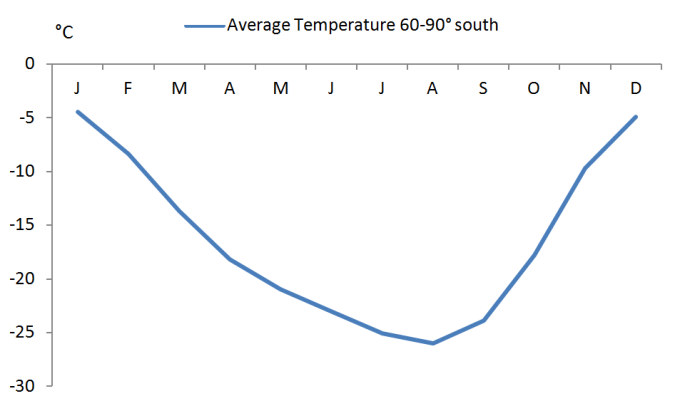
- The Antarctic is slightly warmer in summer and about 20°C cooler in winter.
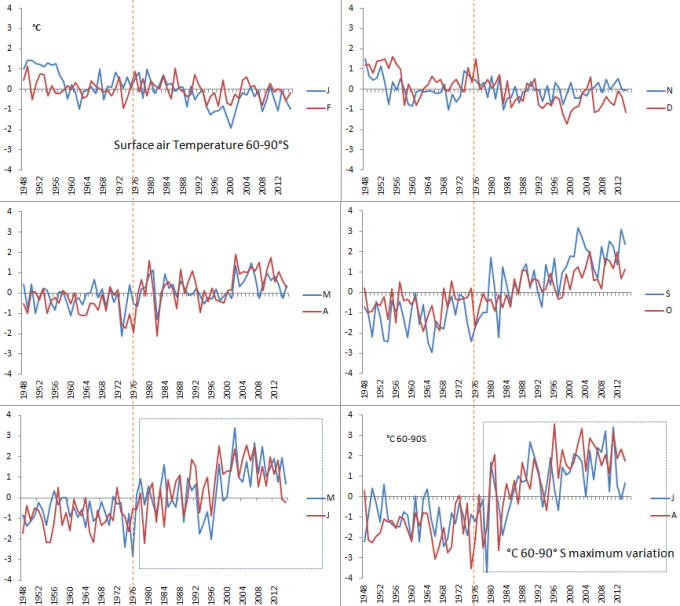
- The discontinuity in Antarctic temperature in winter prior to and after 1976
This data suggests that the two poles are very different environments in terms of their atmospheric processes. If you live in the northern hemisphere welcome to the reality of what drives your weather in the very long term. Broadly speaking, the multi-decadal changes in the global atmosphere are driven from Antarctica while the inter-annual variations are a product of violent swings that occur in the Arctic winter. The long term evolution of northern hemisphere climate can not be understood without reference to Antarctic processes. In polar regions, in winter, the air is highly mobile.Change in the temperature at 10 hPa indicates a change in the temperature profile due to change in atmospheric processes.
THE WINTER POLAR VORTEX
There is a lot of nonsense written about the polar vortex in standard issue climate science. What follows is a common sense interpretation. It describes the archetypal situation in the Antarctic, not the flim-flam phenomenon that manifests in the Arctic.
After 1948 the temperature of the stratosphere over both poles gradually increased in both summer and winter. The greatest increase incurred in winter indicating a change tied to atmospheric dynamics at the winter pole at a time when high surface pressure results in the intake of cold, ozone deficient air from the mesosphere.
The inflow of mesospheric air is associated with and strictly dependent on the seasonal advance in surface pressure. It is associated with the establishment of what is very confusingly called the ‘polar vortex’.
There is a cone or funnel shaped interface between two very different types of air in high latitudes in winter. Think of a funnel with the tube like extension at its bottom removed. This funnel is wide at the top of the atmosphere (50 km in elevation) where it sits at about 40° of latitude and narrow at 200 hPa (10 km in elevation) where it lies at 60-70° of latitude. So, it has an annular or ring like shape about the pole but wider at the top than at the bottom. Ozone warmed low density air from the mid latitudes rises to the top of the atmosphere on the outside of this funnel and cold dense mesospheric air descends within ##the funnel. But there is no actual funnel. There is just an interface between two types of air. Mixing occurs at the bottom, up the sides and down through the top of the funnel. The depth of the funnel takes in a 40 kilometre extent of the atmosphere and it involves the upper 20% of its mass including most of the part that contains ozone. The funnel tends to be discontinuous. Cold air escapes the interior on daily time scales. By means of the addition of mesospheric air we see change in the ozone content of the global ozonosphere that takes in the upper troposphere where marked differences in air density at 60-70° of latitude are responsible for the formation of polar cyclones. These cyclones move about the Earth in the same direction of rotation as the Earth itself but faster. Within the cyclone the air ascends. That ascent continues to the top of the atmosphere (outside of the funnel) and it sucks in air from the surface. In winter when this phenomenon is strongest, wind speed reaches 400 km per hour at the 200 hPa pressure level and accelerates further as it ascends to the top of the atmosphere. Below 200 hPa wind speed falls away towards the surface by about half. Wind speed is a good guide to the location of extreme gradients in the density of the air.
The descent of mesospheric air within the funnel constitutes a sort of tongue. The extremely low temperature within the tongue is unrelated to surface conditions. It is due to the origin of the air in the mesosphere. An enhanced intake of mesospheric air dilutes the ozone content of the stratosphere globally. However, to counteract this erosive force, ozone proliferates in the winter hemisphere due to reduced photolysis due to the absorption of UVB at low sun angles. Secondly, it may well be that ionisation due to cosmic ray activity can produce ozone over the poles. The balance of these competing activities determines whether the partial pressure of ozone increases or decreases. In springtime, as part of the final warming, air from the troposphere is dragged across the polar cap destroying ozone (creating the ‘hole’) and enhancing the density gradient between ozone rich and ozone poor air driving enhanced polar cyclone activity and forcing surface pressure at 60-70° south to its annual minimum.
Ultraviolet radiation from the sun plays no part in this process because it happens during and following the polar night.
The most extreme temperature response to an increase in the ozone content of the atmosphere occurs over the polar cap at 10 hPa that is virtually the top of the atmosphere. This is due to the highly convective nature of the stratosphere in high latitudes, a concept that is unknown to ‘blinkered standard issue climate science’. At the top of the atmosphere ozone is perhaps being actively photolyised by short wave UVB. But it is also being dragged into the descending cone of mesospheric air that contains mesospheric species like N2O that destroy ozone.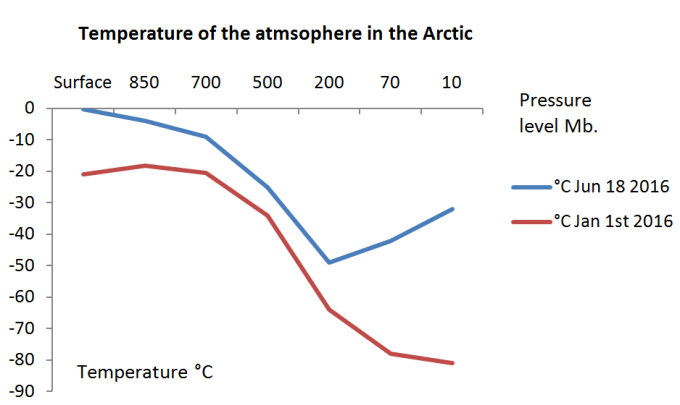
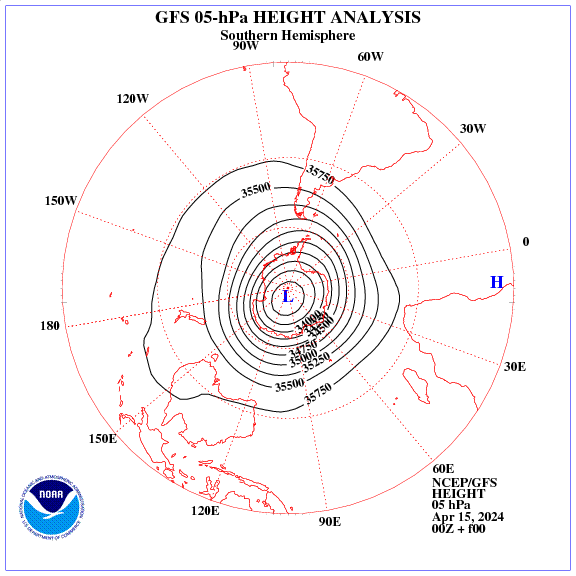
From the shape of the curves in the diagram above we can infer that mesospheric air descends to the 200 hPa pressure level. The curves represents the temperature of the air on a particular day. On a different set of days the level may be higher or lower. At the 200 hPa pressure level 80% of the mass of the atmosphere is below and 20% above.
CLIMATE CHANGE
Why did 10 hPa temperature increase after 1948 and particularly after 1976? I suggest that extra-planetary influences slowed the east west super-rotation of the atmosphere about the pole reducing the intake of mesospheric air. Alternatively, an enhancement of cosmic ray activity resulted in ozone production that in itself, via polar cyclone enhancement is capable of lowering surface pressure in high altitudes. At any rate, surface pressure has fallen by about 10 hPa at the Antarctic pole over the last 70 years as the temperature of the stratosphere over the pole increased as shown in the graphs above.
Standard issue climate science conceives that warming in the stratosphere in high latitudes is generated by activity in the troposphere that propagates upwards as ‘planetary waves’. However, recent work by those who discuss the issue in terms of the ‘annular modes’ phenomenon identifies a top down mode of causation. It is irrational to conceive that shifts in atmospheric mass (decline in polar surface pressure and increase in mid latitude pressure) and upper air temperature that are other than simply oscillatory in nature can be a product of activity in the troposphere. There is nothing internal to the troposphere that could cause the temperature of the stratosphere to rise so precipitately between 1976 and 1980 and then to decline quite slowly as we see in the graphs above.
Neither is it plausible to suggest than an increase in ionising radiation from the sun could cause this phenomenon in the middle of winter. The only source of energy to warm the atmosphere in winter is infrared from the Earth via the activity of ozone. This is another concept that is foreign to standard issue climate science that comprehensively fails to get to grips with the behaviour of the atmosphere in high latitudes where the global circulation of the air is determined. Climate science and its mathematical modellers are obsessed with the idea that it is the energy that is absorbed in the tropics that drives the system and that the system is self contained. However, it is plain that the atmosphere super rotates in the same direction as the Earth and the closer to the winter pole, and the higher the elevation, the faster it moves. As a rule of thumb in physical systems, the biggest impact is always seen closest to where the force is applied.
The concept of the Earth’s atmosphere as an electromagnetic medium super-rotating in winter in high latitudes and susceptible in its rate of rotation to the solar wind is anathema to climate science. The concept of cosmic rays ionising the air over the poles resulting in the production of ozone is not new to science in central and Soviet Europe. But it is very new to standard issue western climate science. That version of climate science is agenda driven and it does not see what it does not wish to see.
How did the build up of ozone in the stratosphere prior to an after 1976 affect surface temperature? We will now investigate that question systematically. We start in the Arctic, move to the mid latitudes of the northern hemisphere, the low latitudes of both hemispheres, the mid latitudes of the southern hemisphere and finally to the Antarctic continent.
We will see that the manner in which the climate has changed identifies the natural factors at work linking surface temperature change to the properties of the evolving nature of the atmosphere of the winter hemisphere. All data is sourced here (http://www.esrl.noaa.gov/psd/cgi-bin/data/timeseries/timeseries1.pl).
CHANGE AT THE SURFACE IN THE ARCTIC
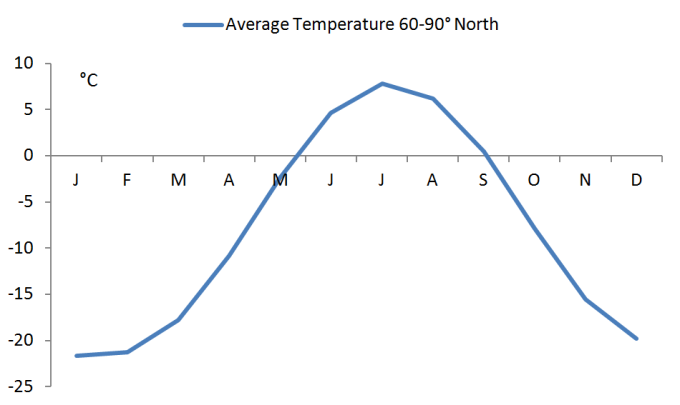
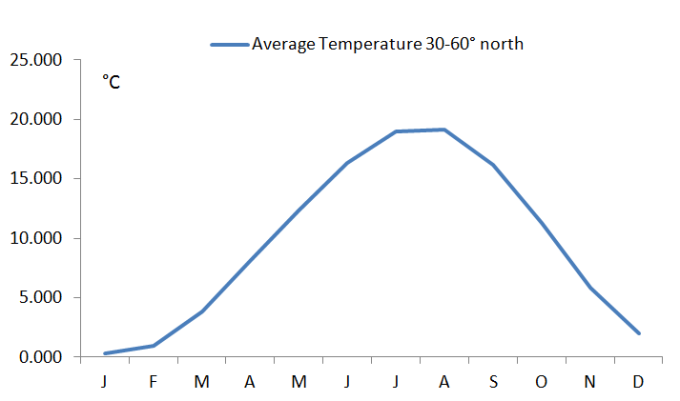
First off we examine the Arctic. The graph above indicates the average temperature across the year. This is the sort of data that holiday destinations provide to people thinking of going on vacation. There is a very good reason why the Arctic is virtually uninhabited by man and nobody goes there on vacation. Even if the Arctic were a little warmer there would be no rush to populate it.
The axes of the graphs below are standardised to facilitate comparison. They trace the evolution of temperature according to the month of the year between 1948 and 2015. Each month is presented successively in an anticlockwise rotation starting with January and February and ending with November and December. We are interested only in the big picture, the differences in the evolution of surface temperature in each month of the year. The differences are enormous. Whether there is an error in the data that of the order of a fraction of a degree is of no interest whatsoever.
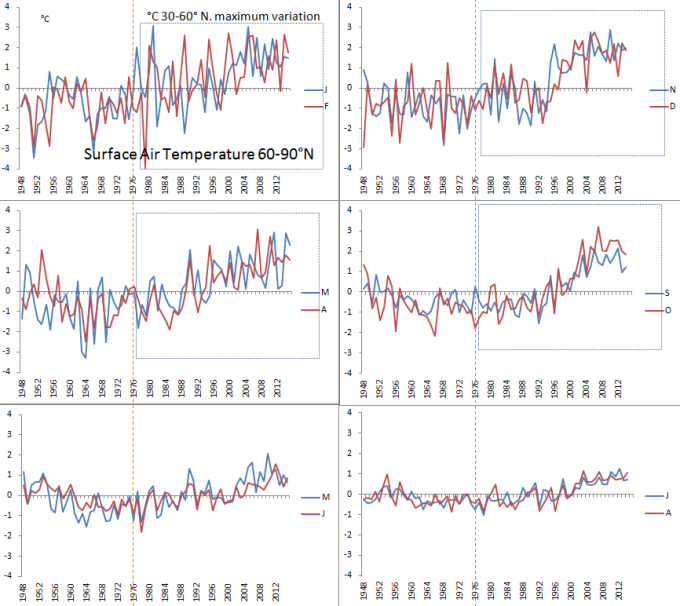
In winter, between November and April there is enormous variability in surface temperature from one year to the next. This is not the case in summer.
After 1976 winters were warmer. Yes, the Arctic warmed in the dead of winter at a time when the sun does not shine and outgoing radiation reaches its seasonal minimum. Plainly this sort of warming is not due to back radiation from carbon dioxide that should warm in both summer and winter, and given the extra radiation in summer more warming would be expected in summer than in winter.
All months exhibit cooling prior to 1976. After 1976 all months exhibit warming but to varying degrees and with different patterns and slopes. Temperature changes differently according to the month of the year as does the ozone content of the air in high latitudes and the direction of the surface winds. The temperature of the near surface air is determined according to its origin. The atmosphere above the icy surface in winter is warmer than the surface. Generalised warmth in winter is associated with an intake of warm moist air from the mid latitudes. Whether the air is flowing in or out of the Arctic is a function of local surface pressure in relation to that in the mid and low latitudes. The latter vary very little but polar pressure varies a lot. An inflow of warm air from the mid latitudes is the essence of the warm phase of the ‘Arctic Oscillation’. Napoleon, impulsively chose to invade Russia during a cold phase of the Arctic Oscillation in in 1812. Hitler ran into another cold phase in his invasion of Russia in 1941. The cold phase in the mid latitudes is associated with a deficiency of ozone over the polar cap, low temperatures in the stratosphere, weak polar cyclone activity at 50-70° north, high surface pressure over the pole and the jet stream looping southwards to bring icy conditions to the mid latitudes.
In the very long term, over hundreds of years, the ozone content of the global stratosphere is modulated by the relatively steady state the southern polar vortex with enhanced variability in winter and spring. Along with the final warming in Antarctica there is ‘the hole’ that is part and parcel of the warming and has always been so. The increase in the temperature of the Arctic stratosphere in summer after 1976 is due to to influence of the Antarctic. Notice the static surface temperature in November, December, January and February since the turn of the century. It seems we had a ‘change point’ about the end of the century where the warming ceased.
The month of greatest temperature variability in the Arctic is January and February when the stratospheric vortex is at its height of activity but establishing either weakly or strongly from year to year. In fact, the ozone charged nature of the northern stratosphere forces the most extreme variability in surface temperature in the months of January and February all the way between the northern pole and 30° south latitude.
In standard issue climate science there is no explanation for this marked variability in the surface temperature in the middle of winter. The ‘amplification’ of temperature swings in the middle of winter is not simply a function of latitude. As we will see it extends across latitude bands and is tied to January and February even in the tropics. The ‘polar amplification’ proposition that purports to explain the enhanced temperature variability in high latitudes is implausible, first because the warming is confined to just the winter months and secondly because it is not confined to polar latitudes. This AGW story does not add up.
The anthropogenic mode of surface temperature increase in standard issue climate science should have no seasonality. In the real world we observe a natural mode of climate change driven from the poles in winter. It emanates from the stratosphere as it responds to external stimuli. It’s mode of operation involves shifts in atmospheric mass wrought by change in the ozone content of the air. There is a waxing and a waning of the zonal and meridional components in the movement of the air affecting the equator to pole temperature gradient. That is the true nature of climate change. This mode of climate change has nothing to do with the activities of man.
CHANGE IN THE MID LATITUDES OF THE NORTHERN HEMISPHERE
The unfortunate thing about the mid latitudes in the northern hemisphere is the severe winters. The nice thing about the change in the climate that has occurred since 1976 is that, following a period of cooling up to 1976, winter temperatures became less severe while summer temperatures remained virtually unchanged. But all good things come to an end and since the turn of the century winter temperatures are no longer increasing.
The scale on these graphs is the same as used for the Arctic with 8°C on the vertical axis. We needed that much to cater for change in the Arctic. Notice the much reduced variability at 30-60° north by comparison with the Arctic.
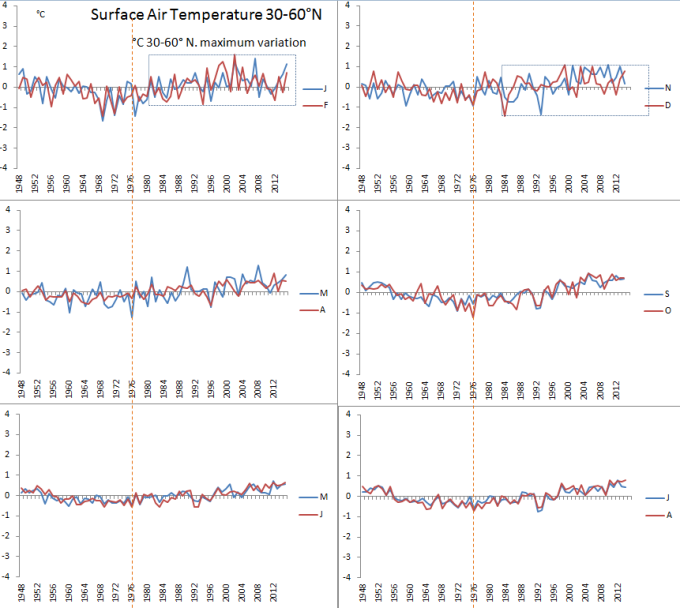
Again, we see that winter is the season of change. Again we see cooling prior to 1976.
The silly thing about the calculation of the global temperature statistic is that it can never be an index of human welfare or the suitability of the planet for human habitation. The bulk of the Earths population lives in the northern hemisphere and the truth of the matter is that winter is inconveniently cold. The warming that occurred has been wholly beneficial. Why would the proponents of standard issue climate science complain about that? In truth, these people live in a world of their own where apples and oranges are aggregated as if they grew on the same tree and tasted exactly the same.
CLIMATE CHANGE IN THE NEAR EQUATORIAL LATITUDES OF THE NORTHERN HEMISPHERE
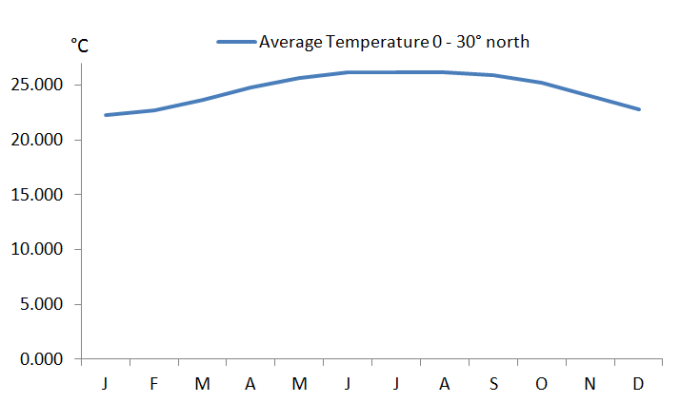
The northern tropics are a truly favourable zone for agriculture with temperature hovering about the 25°C optimum for photosynthesis across the entire year.
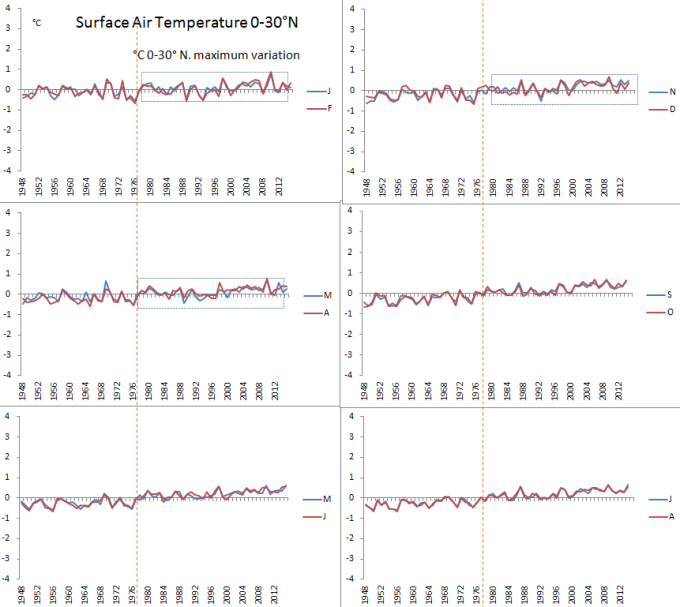
Temperature variability is greatest in January and February. There has been little change in these months over the last seventy years except for an uptick of about half a degree from the mid 1990’s probably reflecting the process of warming in higher latitudes. The temperature of the tropics very much depends on the intake of cold waters on the eastern sides of the ocean basins. The ocean currents respond to wind and surface pressure. Surface pressure depends on the ozone content of the upper half of the atmospheric column. A step increase in the temperature of the tropics occurred after 1976 in January and February. That step change is reversible.
CHANGE BETWEEN THE EQUATOR AND 30° SOUTH LATITUDE
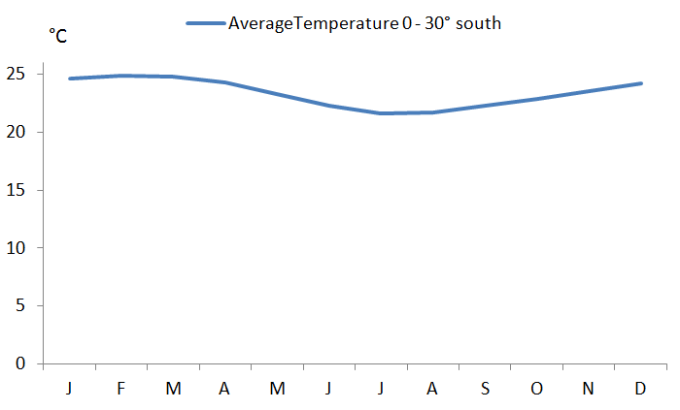
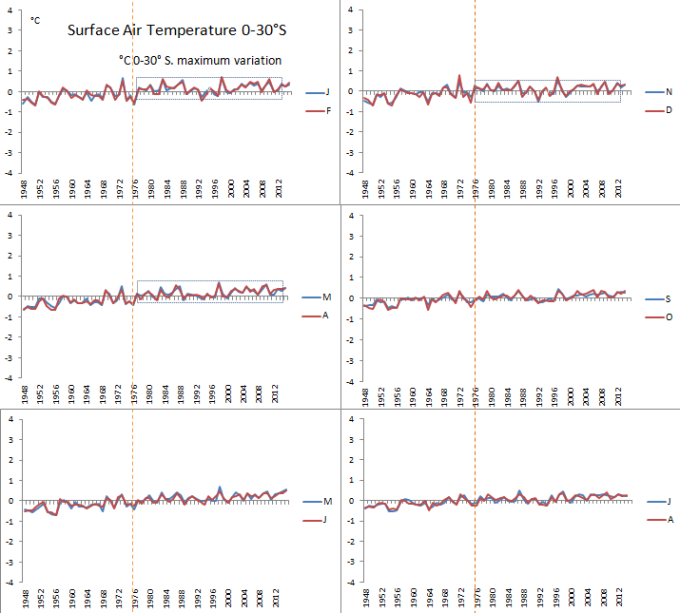
Between the equator and 30° south air temperature from October to March moved to a plateau at a slightly elevated level in relation to the gradually warming regime that existed prior to 1976. Enhanced variability is driven primarily from the Arctic between November and April. This continues the theme that prevails across the northern hemisphere.
CHANGE IN THE MID LATITUDES OF THE SOUTHERN HEMSIPHERE
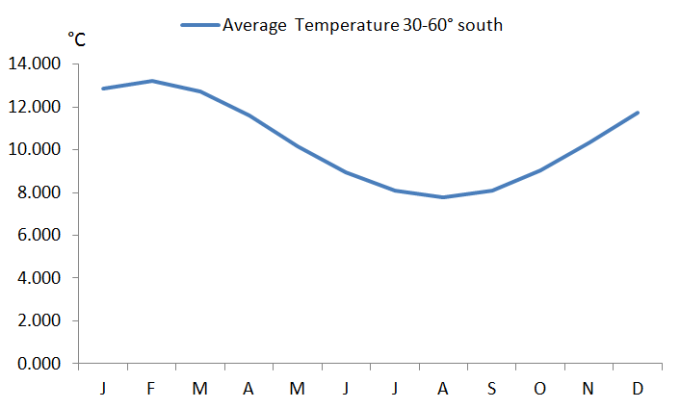
The temperature of the mid latitudes of the southern hemisphere reflects the the dominance of sea over land in terms of surface area. Winter temperatures are far less extreme than in the northern hemisphere but cool enough to strongly inhibit photosynthesis in winter. Summer temperatures are about 10°C short of the optimum for photosynthesis. Plants are at the base of the food chain. Humanity depends upon plant growth for its sustenance.These latitudes are a tough gig for humanity especially on the west coasts and continental interiors that tend to be very dry.In inland areas winters are distinctly chilly. This latitude band is a bit cool for both personal comfort and plant productivity.
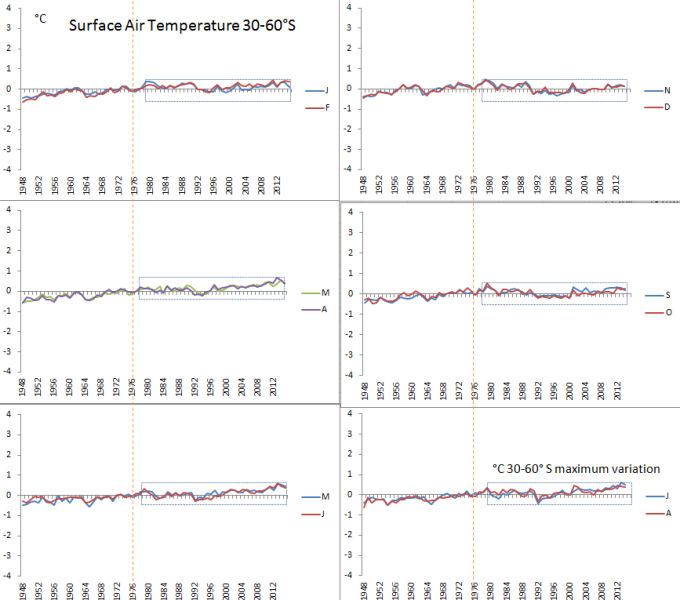
Surface temperature at 30-60° south is much less variable than in the mid altitudes of the northern hemisphere. There is a slight tendency for variability to be stronger in July and August. Some months show warming after 1976 and other months no warming.
The years prior to 1976 showed a relatively steep increase in surface temperature but in most months the rate of increase falls away after 1976.
CHANGE IN ANTARCTICA
The Antarctic is unremittingly cold all year round. No plants can grow. This is a place of scientific interest only. Hardy souls come here in search of adventure. Many pay with their lives. The interest in the climate of Antarctica resides in whether it will ever warm sufficiently to release the ice that depresses the continent into the Earths crust. The area of solid ice that forms about the margins of the continent in winter is as large as the continent itself. Antarctica has the same area as Australia. Ice mass has been increasing in spring and summer as Arctic ice has been retreating. While the temperature of the air remains below zero all year round this situation is unlikely to change very much.
Temperature variability is extreme all year round but particularly so in winter from March through to November. Between November and February when the ice mass might be under threat if the temperature of the air were to rise above freezing point, the continent has cooled continuously over the period of record. In autumn, winter and spring the air warmed strongly after 1976. Strongest warming occurred at the coolest time of the year in July and August. A warming of the air by 2°C when that air is 30°C below zero in a location where nobody lives is not a threat to the existence of humanity. It is not the result of selfish consumption by the few scientists that keep their lonely vigil at the expense of succeeding generations. Why would we think it appropriate to include statistics for Antarctica in an index that is supposed to relate the the welfare of succeeding generations unless the intent were to deceive?
THE WARMING MECHANISM
Warming in high latitudes in winter is the product of a process set in train by an increase in the ozone content of the air. An increase in the ozone content of the air can result from a reduced intake of mesospheric air or an increase in cosmic ray ionisation. The former depends on the rate of super-rotation of the atmosphere that is dependent on the electromagnetic character of the near Earth environment as it reacts to the solar wind and the radiant output of the sun. Once set in train an increase in the ozone content of the air enhances polar cyclone activity that shifts atmospheric mass to the mid latitudes with knock on effects on the polar vortex via the loss of atmospheric pressure over the polar cap.
The impacts of the increase in the ozone content of the air are multiple. The westerlies blow harder in winter bringing warm air from tropical latitudes to high latitudes.This changes the equator to pole temperature gradient. It is one of two mechanisms involved in high latitude warming. The second involves a loss of cloud cover in the mid latitudes where the westerlies originate. As surface pressure increases in the mid latitudes the area occupied by high pressure cells increases. The increase in the ozone content of the air gives rise to warming of the atmospheric column, increased geopotential height and surface warming. The relationship between geopotential height and surface temperature is observed and acknowledged. The result of an increase in the ozone content of the air is an increase in geopotential height.
THE ‘DANGERS’ OF WARMING
Warming in cold climates in the depth of winter should not be a matter for concern but congratulation. It beneficially extends the growing season on a planet that tends to be unfavourably cool in winter. This good news is turned into bad news when incorporated in an average for the temperature of the globe as a whole. That perceived increase then becomes as excuse for a social agenda involving widespread interference in markets to favour producers of particular forms of energy. These forms of energy are only available intermittently. These intermittent systems must be backed up with plants that are capable of running continuously. All plants are most efficient when run at close to capacity. All plants are more expensive to run when ramped up and down or stopped altogether to cater for the input of energy from variable sources like wind and solar. This idiocy comes with a big price tag when we factor in the capital costs to enhance energy efficiency in buildings. We pay for energy three or four times over when all the adaptations are factored in.
There is no virtue in a precautionary principle unless we are sure that the works of man are changing the climate system in such a way as to promote warming in summer. Plainly other forces are involved.
Here are some polite reminders:
- The pattern of temperature change that is observed is very different to that expected from back radiation by uniformly distributed absorbers of long wave radiation.
- For many people (activists) this notion of anthropogenic climate change is a matter not of knowledge and observation but of belief. Actions based on belief are non adaptive. These actions can be very costly.
- The globe has not warmed for sixteen or more years while the carbon dioxide content of the atmosphere has continued to increase.
- Carbon dioxide is plant food and has beneficial effects for plant life and photosynthesising organisms in the sea. These forms of life are at the base of the food chain.
- The use of a global temperature as a metric of human welfare is insupportable.
- Science that is funded out of the public purse always becomes a servant to those in control of the public purse.
- The poor people of the world require the least expensive sources of energy and it is selfish and inhumane to deny them supply.
The green agenda on ‘climate change’ is not humane. It is an agenda for social change involving impoverishment and deprivation. We need a new breed of politician who can take advantage of the support that is waiting in the wings for a rallying cry. The bulk of humanity is waiting in a state of increasing frustration and dismay. How many ratbags will we have to put up while waiting for a person with a modicum of common sense to turn up?

Hi Erl, loving the plain speaking style and presentations …a Point of clarification, if “the multi-decadal changes in the global atmosphere are driven from Antarctica”, then later.. “Antarctic stratosphere was much cooler than the Arctic prior to 1980. At that point it warmed strongly and caught up with the Arctic.”. As written, it appears counter intuitive for the “Antarctic Driver” follow Arctic temperature? sorry for being picky on a point where I think I can interpret what is meant. It will take me time to absorb all this. Cheers.
LikeLike
Hi Macha, The Antarctic is the long term driver because it sets the broad framework via its 100 year descent and 100 years ascent in atmospheric pressure. Within that framework the Arctic is responsible for quite vicious short term swings. But those short term swings are actually dictated by the direct reliance of Arctic surface pressure on Antarctic surface pressure. This is a mirror image effect that is short term in duration, a matter of a few years.
Surface pressure is dictated by the ozone content of the atmosphere as it determines polar cyclone activity. In that respect Antarctica has the upper hand due to the distribution of land and sea.
LikeLike
Hi Erl,
I agree with much of what you have written here, including the commentary on politics, climate scientists and activists. Some of the political commentary seems to recur in succcessive postings though, which I feel detracts from the flow of your more strictly scientific material. It is your site though, so naturally you can say what you want about frustations with the way others view the world.
I particularly like this bit:
“The impacts of the increase in the ozone content of the air are multiple. The westerlies blow harder in winter bringing warm air from tropical latitudes to high latitudes.This changes the equator to pole temperature gradient. It is one of two mechanisms involved in high latitude warming.”
Over much longer time frames there is a millenial scale cycle in the surface temperature gradient from 40 to 70 deg Sth, driven largely by the impacts of precession and obliquity in the Southern Hemisphere. This cycle coincides nicely with that found in average annual average temperature derived from Antarctic ice-core chemistry. The very long-term evolution of Antarctic temperature is substantially controlled by the late winter to spring time surface temperature gradient, which is in turn controlled by the solar insolation gradient. This can be found by differencing the insolation between 40 and 70 deg south in each individual month over the last 800 thousand years, calculating its impact on temperature at 40 and 70 deg sth, then compiling a 12 month index for the cross-latitudinal effect. Then it becomes apparent that long-term temperature cycles are in Antarctica are controlled by the meridional transport of heat. Once you cotton onto this the need to use CO2 as the prime explanation for Antarctic temperature change is much reduced.
To me one of the appealing aspects of your work is that it tends to remove CO2 as a fundamental driver for high-latitude Southern Hemisphere temperature change on relatively shorter timeframes (months to hundreds of years). I wonder if there is any proxy that could be used to extend the timeframe to thousands of years.
LikeLike
Rob R. I wouldn’t be bothered investigating the causes of climate change if the matter had not been made political by the climate (CO2) police and the governing establishments. I am amazed at how this can happen. I see a crying need for education so that voters learn to make choices that are better for mankind.
You comment: long-term temperature cycles are in Antarctica are controlled by the meridional transport of heat. I would agree with this. The agent of change is partly that which shifts atmospheric mass to mid and low latitudes and enhances the westerly flow. But, the effect depends on the latitude. Currently its colder at 33° south latitude because Antarctic surface pressure has reached an unprecedented low point not seen in the last 70 years and polar air is reaching out further towards the equator. But at 20°-25° south latitude where there is increased descent there will be less cloud. The differential pressure between the mid latitudes is enhanced and more warm air should be travelling polewards probably enhancing cloud cover (and precipitation) in high latitudes.
So far as the equator is concerned the rate of influx of cold water that is driven by the Antarctic Circumpolar current that is in turn responsive to the westerly winds changes the amount of cold/warm water that sits at the surface in the tropics and the rate of movement of warm tropical water into higher latitudes. This sort of temperature change is due simply to a mixing effect rather than energy gain or loss via change in albedo. Its the change that is monitored as sea surface temperature change. That’s affected by the rate of up-welling of cold waters and the volume that flows into the tropics. If we are really interested in monitoring global temperature we should discount for this mixing effect or perhaps monitor temperature at some depth below the surface that is relatively unaffected.
Can you see evidence in the ice cores of large variations in Spring and how does that manifest?
Looking at the trends by month in surface pressure over the Antarctic pole (70 years) and projecting on that basis to guess at what we will see on 10 and 20 year time scales: I chance my hand to say this:
In the southern hemisphere, the first half of the year will see declining surface pressure and colder conditions in mid to high southern latitudes.
The last half of the year will see rising surface pressure in high latitudes and warmer conditions than in the recent past certainly south of about 35° south. This will involve an earlier ‘final warming’ in the stratosphere. Cloud should increase in the mid latitudes in the last half of the year.
There should be a strong precipitation response in that part of Antarctica west of the Peninsula. Lots of warm moist air heads in that direction from the Coral Sea and Indonesia.
LikeLike
We know that cosmic rays vary inversely with sunspot activity. Currently its at at a high level.
We know that the amount of ionising radiation and the the inflation of the atmosphere varies positively with sunspot activity.
Sunspot activity and UV radiation is currently low due to weak solar cycle 24. Sunspots may disappear in succeeding cycles.
We know that surface pressure in high latitudes varies with the ozone content of the air via polar cyclone activity.
We know that atmospheric pressure falls to its annual minimum at 60-70° south at the time when the ozone hole manifests between September and November. There is much ozone without and very little within the vortex below 50hPa at that time.
We know that surface pressure between 50-90°S Lat. has never been lower than it it is at the moment.
What would it mean if ozone creation in the winter hemisphere were under the control, not of solar activity or the supposed equator to pole transport by a supposed Brewer Dobson circulation, but rather the activity of cosmic rays? As noted here: https://reality348.wordpress.com/2016/06/23/27-cosmic-rays-ozone-and-the-geopotential-height-response/
We would then see the equator to pole temperature gradient under the control of ozone as it varied with cosmic ray activity. That would give rise to a cycle of about 100 years and another of 200 years that is more severe.
LikeLike
Ok. And we now see Nature reports of increased cloud cover at higher altitudes in SH. Ie its a water response to shifting energy flows that will be countered by it being lost to space at a more rapid pace to maitain overall ewuilibria. Else after all the past millennia, we would otherwise be about to see a “Runaway” tipping point – which is rubbish. We should enjoy this interglacial becuase it appears its going to get colder.
LikeLike
Sorry for my poor typing on touch tablet. I saw this and thought you might like the focus on observations rather than modelling… Note the two data sets separated by 75 years are hardly different at all. So the Earth has warmed a little but most people worldwide are now better off for it. Love the classification by type rather than one global too.
Climate classification revisited from Köppen to Trewartha, Belda, M. et al, Climate Research, 2014
Click to access c059p001.pdf
LikeLike
Where is that report Macha?
LikeLike
This one? http://www.nature.com/nature/journal/vaop/ncurrent/full/nature18273.html
Cheers
LikeLike
Thanks Macha. Whats up with your email?
LikeLike
From the abstract:
“Observed and simulated cloud change patterns are consistent with poleward retreat of mid-latitude storm tracks, expansion of subtropical dry zones, and increasing height of the highest cloud tops at all latitudes. The primary drivers of these cloud changes appear to be increasing greenhouse gas concentrations and a recovery from volcanic radiative cooling. These results indicate that the cloud changes most consistently predicted by global climate models are currently occurring in nature.”
Oh Dear. A complete misunderstanding of what drives changes in cloud cover. Rule number One. Begin with the observation that change in surface temperature aligns with change in geopotential height. Rule number two: Work out what greenhouse gas (long wave absorber) can be responsible for a change in geopotential height. Hint: That gas can not be uniformly distributed because these changes occur in discrete areas.
LikeLike
Yeah, all the words to get the perpetual cycle of feferences. Ie the grant money tree. So many reports are meally mouthed. Words like Might, could, if, suggest, possibily, appear. So much fear of failure, yet the binary nature of absolutes will drive decision making where fence-sitting simply gives an out which breeds mediocrity. Like establishing a direct cause-effect, “appearances” can be deceiving. Even with your ground up ozone-pressure mechanism, we see it but could still be a bit-player relative to water/humidity and winds because of the vast difference in energies. from inertia we know Smaller masses need more energy to move larger masses.
LikeLike
Erl,
On a millenial timescale there is also a cycle in terms of Antarctic precipitation. First, in the varioous deep ice cores the annual quantity of precipitation has a cycle that closely matches the cycle in annual average surface temperature. Second using some cunning work on the isotopic composition of the ice they have identified a cycle in the distance over which the moisture has travelled to reach Antarctica. This second cycle has not been studied over the full length of the ice core record however. Basically the average location of the oceanic source region becomes either closer to or further away from Antarctica. One would expect this to be a reaction to changes in the meridional temperature gradient and/or changes in the meridional pressure gradient. In fact it really has to be both given that temperature and pressure are so intertwinned. But this will not be news here given the things you have been discussing for several years.
LikeLike
From my perspective, temperature is a product of geopotential pressure, rather than pressure product of temp. So the question to ask is, can ozone provide sufficient partial pressure at a few hundred ppmv to produce the observed temperature changes in SH / Antarctic.
LikeLike
Macha,
‘Geopotential pressure’? A new concept to me. I am familiar with ‘Geopotential Height’
Geopotential height is the actual height (in metres) of a pressure surface above sea-level. It varies directly with the temperature of the air below that height. The normal height of the 500 hPa pressure surface where 50% of the atmosphere is above and 50% below (when surface pressure is measured as 1000 hPa) is 5500 metres. If the height of the 500 hPa pressure level is found to be 5800 metres it is because the air below that level is warmer.
When surface pressure falls it is because there are fewer molecules in the entire atmospheric column above the point of measurement. That comes to be only when the kinetic energy in the molecules in the atmospheric column is enhanced. It gets to be enhanced because energy is acquired somehow. One way to acquire energy is via the stream coming from the sun, another via the stream coming from the Earth. CO2 is well mixed and can not account for change in geopotential height. Water vapour and ozone are not well mixed. Both can acquire energy in the infrared frequencies. The greatest source of energy in the infrared is the Earth itself.
When you map the ozone content of the air in terms of ‘Dobson units’ that map is also a map of surface pressure. Elevated total column ozone yields low surface pressure. Depressed total column ozone yields high surface pressure.
When air is confined as in a rubber tube inside a relatively inflexible bicycle tyre and more air is pumped into that tube the pressure rises.
In the atmosphere, if the kinetic energy in a hypothetical column of atmosphere that may be 6000 kilometres in its surface area (as seen at the surface of the Earth), is increased, the air is not confined as it is in a bicycle tube. Surface pressure does not rise. It falls. The total number of molecules in the column diminishes as kinetic energy is acquired. This yields a fall in surface pressure in direct proportion as the number of molecules in the column diminishes. If the energy is acquired above 500 hPa geopotential height (and not below) the height of the pressure surface does not change at the 500 hPa pressure level. But it will change above for pressure surfaces above that point.
In monitoring change in geopotential height meteorologists take a lot of interest in change in geopotential height in that part of the globe between 50° and 80° of latitude in the winter hemisphere. That’s where we see the largest variations in the ozone content of the air. See here: http://www.cpc.ncep.noaa.gov/products/stratosphere/strat-trop/gif_files/time_pres_HGT_ANOM_ALL_NH_2015.png
That’s from this page: http://www.cpc.ncep.noaa.gov/products/stratosphere/strat-trop/
The state of the atmosphere today and forecast change can be seen here: http://www.cpc.ncep.noaa.gov/products/stratosphere/strat_a_f/
in particular compare
Will send the latter in an email.
LikeLike
All this is explicable given the way in which surface pressure changes in response to change in the ozone content of the air on inter-annual through to inter-centennial and longer time scales. The Pacific Ocean to the east and north of Australia is warm, tends to promote the formation of low pressure cells in the neighbourhood of New Zealand that correspond with enhanced ozone partial pressure in the atmospheric column, more so when ozone values are enhanced. That ocean is also the source of a stream of moisture drawn towards West Antarctica and the Ross Sea. The moisture stream will be enhanced/diminished according to the matrix of surface pressure between New Zealand/Australia and West Antarctica. The large high pressure cell that forms in the Pacific Ocean to the west of Chile will participate in the interaction. The key to unravelling the duration of the cycles of climate change will be in those ice cores. The key to explaining the origin of the change will be in understanding how ozone partial pressure changes on the same time scales. The geometry of the air flows depends on ozone.
To the west of Australia where I live the enhancement of the Indian Ocean high pressure cell that occurs in winter interferes with the flow of moisture southwards. JRA 55 year atlas shows recent climatology here:http://ds.data.jma.go.jp/gmd/jra/atlas/en/surface_basic.html
But climatology in the southern hemisphere changes faster to greater extremes than anywhere else on the globe. It deserves attention. If some of the effort directed at studying the EL Nino phenomenon were redirected to a study of the southern hemisphere, lo and behold, El Nino might be suddenly explicable.
LikeLike
Its hard to understand the whole while only studying a few fragments. This is true for both modern and ancient climates. One of the problems in climate science is that there are few practicioners who even have a hemispheric viewpoint let alone a global one. Multi-authored studies are no better when none of the individuals concerned can see the bigger picture. The overall patterns and causes are unlikely to emerge from groups who individually have only fragmentary knowledge and interest.
At first glance El Nino appears to the the elephnt in the room, but who is looking at the entire building? Its trees and forests all over again.
The top-down plus latitudinal plus meridional synthesis you are aiming for is certainly holding my attention.
LikeLike
Thanks for the interest and the willingness to comment. I am surprised at the lack of interest from anyone working in the field, especially those who are familiar with the annular modes phenomenon. The level of knowledge about the stratosphere and its processes appears to be abysmal. Even to see an acknowledgement that ozone is a long wave absorber and responsible for temperature differentials where the sun does not shine and there is no ionisation happening would help.Appreciation of its role in initiating polar cyclone activity would immensely assist. Never mind, will soldier on. The end is nigh, perhaps 40 chapters.
LikeLike
Please check the work by Paul Vaughan, Stewart (oldbrew), N. Sidorenkov, Ian Wilson, and others over at Tallbloke’s! Earth’s moon provides a huge upper atmospheric tidal bulge, shifting with a period of 2.3 years, the QBO that shifts what is left of the upper atmosphere from north to south and back again. This is not ocean tides of 12 hours, with Earth’s spin, but the effect of the moon’s swinging orbit with respect to the spin axis of the Earth… Your Ozone effects are perhaps controlled by this shi(f)t! 🙂
LikeLike
Will, thank you for your suggestion. I am aware of these ideas. I suggest your appreciation of the subject will be enhanced if you get a clear idea of the distribution of ozone in the atmosphere and what it means for the Jet streams and the Planetary winds.
To discover the characteristics of the distribution of ozone try this: http://journals.ametsoc.org/doi/pdf/10.1175/1520-0469(2003)060%3C1669%3ATTOFSI%3E2.0.CO%3B2
Now, the QBO has a period of 2.3 years. Perhaps this is connected with the tidal bulge caused by the Moon? If the moon imposes that degree of tidal drag it will indeed be reflected in the distribution of ozone that regulates the planetary winds. To demonstrate that the period of 2.3 years can be discerned in the atmosphere one needs to look carefully at the changing distribution of ozone.
For the role of Cosmic Rays in ozone production: https://www.academia.edu/3190232/An_autocatalytic_cycle_for_ozone_production_in_the_lower_stratosphere_initiated_by_galactic_cosmic_rays?auto=download
LikeLike
Will, It pays to take notice of the distribution of ozone in the atmosphere and the manner in which it affects the temperature of the stratosphere that in turn affects the distribution of surface pressure and the planetary winds from the surface of the planet to the limits of the atmosphere.
Click to access Randel1994.pdf
Coherent variations of monthly mean total ozone and lower stratospheric temperature William J. Randel and Janel B. Cobb 1994
These data furthermore show globally coherent ozone and temperature perturbations associated with both QBO and ENSO variations; a new result here shows large total ozone anomalies in middle-to-high latitudes of both hemispheres associated with ENSO events.
So, quit the claptrap and get serious about it.
LikeLike
erl happ says: July 24, 2016 at 11:26 am
“Will, thank you for your suggestion. I am aware of these ideas. I suggest your appreciation of the subject will be enhanced if you get a clear idea of the distribution of ozone in the atmosphere and what it means for the Jet streams and the Planetary winds.” To discover the characteristics of the distribution of ozone try this:”
This paper says nothing of ozone. It claims of ozone but nothing else! It is but a presentation of how the polar jet streams wander about.
“Now, the QBO has a period of 2.3 years. Perhaps this is connected with the tidal bulge caused by the Moon? If the moon imposes that degree of tidal drag it will indeed be reflected in the distribution of ozone that regulates the planetary winds. To demonstrate that the period of 2.3 years can be discerned in the atmosphere one needs to look carefully at the changing distribution of ozone.”
There is no additional drag associated with lunar induced atmospheric buldge/tide! The ocean tide induces drag on Earth’s rotational momentum as sea level height sloshes about in longitude trying to keep up wit the relative position of the moon. The atmospheric lunar tide has nothing to do with Earths rotation. The bulge remain in the direction of the moon that influences Earth’s gravitational attraction on the latitudinal position of atmospheric mass with respect to lunar orbital inclination. A very large part of Earth’s atmospheric mass above the tropopause remains in the direction of the Moon. This is what cycles from north to south and back again with a pereiod of approximately 2.3 years. This cycle is not synchronous with the rotational or orbital period of the Earth. It is not even constant! Its timing is seriously influenced by current location of every other massive solar system body.
“For the role of Cosmic Rays in ozone production: https://www.academia.edu/3190232/An_autocatalytic_cycle_for_ozone_production_in_the_lower_stratosphere_initiated_by_galactic_cosmic_rays?auto=download”
Atmospheric ozone production is principally from UVB, UVC insolation high in the tropical stratisphere, from both O2 and H2O gas. Additional production comes from electrical discharges in tropospheric storms. The issue of GCR ozone production has been offered since 1960, but no method of verification has been offered or attempted! Hand-waving is rampant!
LikeLike