The notion that the climate of the Earth is independent of external influences is a basic tenet of ‘climate science’ as promulgated by the UNIPCC. It is maintained that the only way in which the sun could influence surface temperature is via a variation in TSI (total solar irradiance). Since TSI is invariable it is held that the sun can not be responsible for any variation in surface temperature. In consequence it is maintained that the flux in surface temperature is internally generated and that surface temperature will increase as a function of back radiation from so called ‘greenhouse gases’, the chief of which is carbon dioxide.
But the assumption that change is internally generated is unwarranted. The most cursory examination of the climate record reveals that the Earth has natural modes of climate variation capable of increasing and decreasing surface temperature and to do so at different rates at different latitudes and also between the hemispheres. In this post I will demonstrate that the Earth’s climate system is an open system, that responds to external influences so as to increase and decrease surface temperature. Furthermore, I will demonstrate that this is the only mode of climate variation that is in operation.
The Annular mode concept is described here.
The UNIPCC has a discussion of the Northern and Southern Annular modes here. Climate models are incapable of simulating these natural modes of change. Nor will models be able to simulate the change until the underlying mechanics are understood. Currently, the discussion is about ‘troposphere-stratosphere coupling processes’ jargon for the manner in which change that originates in the stratosphere ‘propagates to the troposphere’. The argument as to whether change begins in the troposphere or the stratosphere is ongoing.
If we investigate the, by now very well documented, ‘Northern and Southern Annular Modes’ of natural climate change we observe:
- At all points on the Earths surface temperature is most variable in winter being driven by Arctic processes that are most influential in January and February and Antarctic processes that are most influential in June and July.
- An interchange of atmospheric mass occurs in winter between high latitudes and the rest of the globe. This changes the balance in the pressure relationships that determine the strength and direction of the planetary winds. In consequence there is change in the equator to pole temperature gradient. In general, because surface pressure is lowest in the region of the circumpolar trough that surrounds the Antarctic continent air flows from the northern hemisphere to the southern hemisphere and from equatorial regions towards Antarctica producing warmer or cooler temperatures at each point along the route according to the origin and strength of the flow of air that emanates from warm or cold places.The natural state of the climate system involves a transition between these warm and cold regimes.
- As atmospheric mass shifts from high to mid and low latitudes surface pressure increases in the latter and it is observed that surface temperature increases in proportion to surface pressure, geopotential height at 500 hPa and the temperature of the air above 500 hPa. Plainly, the surface temperature response is due to change in cloud cover. However, this point is not be made in the literature due to ideological fixation on the notion that surface temperature must be a product of downward radiation from radiating gases. So, the relationship between geopotential height and surface temperature may be acknowledged but is never explained.
- The agent of shifts in atmospheric mass is the relative intensity of polar cyclones that collectively constitute the Antarctic Circumpolar Trough. The vorticity of these cyclones is driven by contrast in air density between 300 hPa and 50 hPa where the stratosphere overlaps with the troposphere and marked conjunctional disparities in tropopause height can be observed. This is where warm ozone rich air from the mid latitudes meets cold, ozone deficient air that occupies the the polar cap in winter. Here, the ozone content of the air is a strong driver of air density. It is observed that air masses characterised by low surface pressure are rich in ozone aloft while air masses that exhibit high surface pressure are relatively deficient in ozone aloft emanating from either the tropics or the Antarctic continent. All air streams meet at the Antarctic circumpolar trough and the contrast in the nature of these air streams is greatest in winter.
- It is observed that the ozone content of the air in high latitudes increases strongly in winter, providing the energy, via the absorption of long wave radiation from the Earth itself to drive convectional uplift to the limits of the atmosphere where ozone accumulates in localised ‘hot spots’ like the north Pacific or the western Pacific in the region of New Zealand.
- The exchange of atmospheric mass that occurs between the high altitudes of the southern hemisphere and the rest of the globe has a fulcrum approximately at 45° -50° south latitude. That fulcrum moves marginally towards the equator when polar surface pressure is reduced and pole-wards when polar surface pressure increases.

Figure 1 documents the reciprocal relationship in atmospheric surface pressure either side of the 50° south parallel. Enhanced polar cyclone activity lowers surface pressure south of 50° of latitude and antithetically, relaxation of polar cyclone activity allows atmospheric mass to return to high southern latitudes.
The ozone content of mid to high latitude air is enhanced in winter. Logically the enhancement is not a product of reduced ionisation pressure due to low sun angle because enhancement is uneven and episodic in nature. The early months of the year when atmospheric mass tends to be drawn to the Arctic, depleting Antarctic surface pressure, is a period when the ozone content of the air on the equatorial side of the Antarctic circumpolar trough is seasonally low. On the other hand, the mid winter months are periods where surface pressure in the high latitudes of the southern hemisphere is high. It is in these mid and late winter months, when polar surface pressure is enhanced, that the ozone content of the air varies most dramatically, and with it polar cyclone activity. It is in these months, where the norm is high surface pressure, that the opportunity for wholesale shifts in atmospheric mass is at its greatest.
It is uncontroversial that the ozone content of the stratosphere depends upon the the ionisation of the oxygen molecule by short wave radiation from the sun. Where this actually occurs and how the ozone content of the air gets to be most elevated at the time and in the locations where short wave radiation is seasonably unavailable should be a matter of great scientific interest. It will no doubt become so when those who study climate open their minds to the possibility to external regulation of the climate system….an open rather than a closed system. Would it not be astoundingly remarkable if the earth system were to be entirely free and independent of external influences? All our experience on Earth is that interdependence and adaptation are pervasive features of natural systems. Why should the Earth be free of influences emanating from its inter-terrestrial environment?
In high latitudes, cosmic rays, emanating not from the sun but from intergalactic space ionise the atmosphere. The neutron monitor that measures the incidence of these rays at the south Poles is pictured below.

"Neutron monitors of the Bartol Research Institute are supported by the National
		Science Foundation."
Neutron data from the Bartol Research institute can be accessed here
The daily Antarctic Oscillation Index (AAO) can be accessed here

To interpret figure 2 one mus be cognisant of the fact that the AAO index can be taken to represent the reciprocal of high latitude surface pressure. When the AAO index rises it indicates a decline in surface pressure south of the 50° parallel of latitude.
Figure 2 indicates that as the neutron count increases surface pressure falls away in high southern latitudes. The surface pressure response appears to lag the neutron count by about a week. It is inferred that ionisation by cosmic rays enables the production of ozone that in turn absorbs long wave radiation from the Earth, enhancing differences in the density of the air and driving polar cyclone activity that is responsible for shifts in atmospheric mass.
It is thought that the intensity of cosmic rays outside the Earth environment is relatively invariable. Within the environment of the Earth and its atmosphere the neutron count, a product of cosmic ray activity, is a function of solar activity. In this reversed out fashion the sun indirectly regulates the ozone content of the atmosphere in high latitudes, the distribution of atmospheric mass and surface temperature. This is, in all likelihood, just one of a many ways that the sun influences the atmosphere of the Earth and surface temperature. The gravitational effect of the moon is a prime candidate so far as the modulation in the flux of atmospheric mass is concerned. The ionising effect of short wave radiation inflates the atmosphere and will condition its response to electromagnetic influences. It should be born in mind that the atmosphere super-rotates with respect to the rotation of the Earth itself and its rate of rotation very likely responds to the electromagnetic environment that is more powerful with elevation, and more so over the poles than at the equator.

Figure 3 indicates that 2015 represents a recent low point in the incidence of cosmic rays as sunspot activity peaks in solar cycle 24. Neutron counts have increased strongly at Thule during 2016. Southern winter has seen a further steep fall in surface pressure in high southern latitudes as documented in figure 4.

Figure 4 indicates that in general sea level pressure varies in a reciprocal fashion either side of the 50° latitude band in the southern hemisphere while surface pressure at 40-50° south is relatively constant.
CONCLUSION
Surface temperature on Earth is a product of the planets dependence on the intergalactic environment in which it exists. Important aspects of that environment include emanations from the sun and also from beyond the solar system.
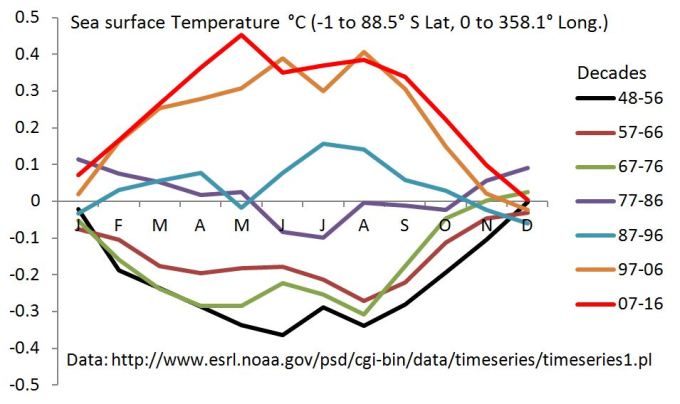
There is good reason to believe that the modes of natural climate change described here can account for the entire spectrum of climate change since 1848. Witness the fact that there has been no increase in surface temperature in the month of December since 1948-56 as documented in figure 5 below. If surface temperature were responding to the increased presence of CO2 one would expect to see a background level of warming in every month. Plainly this is not the case. Plainly, warming and cooling is regulated according to change that originates in high southern latitudes in winter.

You are honey on my heart.
LikeLike
Ren, Your insistence that cosmic rays was an important factor led me in the right direction and in particular the paper from the Russians that you supplied was very important because it showed the chemical pathways. Then, logic led me to the conclusion that all that extra ozone could not come from the tropics where ozone concentration is weak. So, ozone just had to be created by processes that become active in the winter night. The penetration of cosmic rays is also an important factor. It took a bit of patient effort to render hourly data as daily data but the result was very satisfying. When you look at data on a daily basis in a year with fairly stable levels of neutron deposition you don’t have to deal with steep trends in the neutron data. Choosing 2015 was fortuitous. Looking at longer term data other factors intrude and the parallel between the neutron count and surface pressure is disturbed. Those who insist on correlation would likely dismiss the relationship.
I did see a relationship between neutron counts at Thule and southern high latitude surface pressure with respect to monthly data but its not as convincing as that which comes up in daily data over just a year.
From my point of view this is a very satisfying outcome after many years of effort. You have been a partner in this enterprise. Thank you.
LikeLiked by 1 person
Cosmic ray increase by 13% claimed for 2015. Includes balloon data, charted plus ref. To physics journal etc.
http://principia-scientific.org/new-study-solar-cosmic-rays-impact-climate-expected/
And “Earth’s poles aren’t the only place cosmic rays are intensifying”.
LikeLike
Hi Macha,
Svensmarks theory predicts an increase in cloud cover with increased cosmic ray activity. Figure 2 in this post indicates that an increase in cosmic ray activity is followed by an increase in the AAO indicating a fall in polar pressure. The knock on effect is an increase in surface pressure in mid and low latitudes that is always associated with an increase in surface temperature as cloud cover falls away. So, the two theories and predictions are diametrically opposed.
Some pretty eminent climatologists like Meers and Harry Van Loon found that both solar minimum and solar maximum tend to be associated with La Nina type cooling in the tropics that is associated with wind driven influx of cold water from high latitudes into the tropics. That is consistent with falling polar pressure and rising pressure in the mid latitudes. So, the mid latitudes warm as the equatorial waters cool. In general, increased cosmic ray activity fits the La Nina pattern. As the solar cycle picks up cosmic ray activity is attenuated enabling polar pressure to increase, the westerlies and trades slacken, less cold water is pushed into the tropics and we have El Nino warming in the tropics but increased cloud cover in the mid latitudes.
LikeLike
Honey for the heart, indeed.
I know you are not interested in blog sites like Wuwt, but I have been adding some occasional comments with limks to your site..free PR.?!
Anyway,
I like this (link) and thought you might like a read because it talks about observations but it also raises the subject of wind.
https://wattsupwiththat.com/2016/09/10/wind-an-important-forgotten-or-ignored-weather-variable/
What I found odd..somewhat chicken or egg first was this bit…
“.Wind (advection) is created by temperature differences at the surface. This creates pressure differences relatively determined as High and Low. Nature tries to offset the imbalance by moving air from the High to the Low. The strength of the wind is determined by the difference in pressure and the distance between the centres of High and Low known as the Pressure Gradient Force (PGF).”
It implies temperature creates wind which creates pressure?! Perhaps its a case of ambiguous writing and was not intended as being the only mechanism. Still….in a science context it does not read well IMO. Cheers, macha.
LikeLike
Macha, Tim Ball is an acute observer of climate. He is from Canada so he knows the difference between a wind from the Arctic and another from the mid latitudes. Note this comment: “This indicates York Factory was within the zone of the polar easterlies (Figure 4) during the Little Ice Age. Then, as conditions warmed naturally, the Polar Front moved north, and York was in the zone of the Westerlies. The same change did not occur at Churchill approximately 190 km further north (Figure 5).”
He also notes: “AR4 concluded that mid-latitude westerly winds have generally increased in both hemispheres”.
And these are exactly the same sort of thing that I am referring to when I write of changes in the global circulation that are wrought by a change in polar cyclone activity.
One shortcoming in Tim’s article relates to the lack of observation of the increase in wind speed with elevation. This relates to the text you quote: “Wind (advection) is created by temperature differences at the surface.” In fact, the strongest winds are located in the region where the troposphere and the stratosphere overlap and they are related to differences in air density in part due to ozone heating and in part due to the merging of air masses that have different characteristics as these air masses approach the circumpolar trough.
When wind is a response to temperature differences at the surface, the low density of the heated air over a warm surface that gives rise to low surface pressure is indeed a response to the temperature differences at the surface. The phenomenon exists on a very a large scale in terms of monsoons in response to low surface pressure over large hot land masses and on a small scale as a sea breeze.
And thanks for the PR. It’s appreciated. I don’t write for the fun of it but to get a result and the lack of interest is a turn off.
LikeLike
Hi Erl,
Does this imply that an increase in cosmic rays
is associated with an acceleration of the polar
vortex?
LikeLike
The 11 year solar cycle signature on wave-driven dynamics in WACCM
NASA Astrophysics Data System (ADS)
Cullens, Chihoko Y.; England, Scott L.; Garcia, Rolando R.
2016-04-01
This study describes the influence of the 11 year solar cycle on gravity waves and the wave-driven circulation, using an ensemble of six simulations of the period from 1955 to 2005 along with fixed solar maximum and minimum simulations of the Whole Atmospheric Community Climate Model (WACCM). Solar cycle signals are estimated by calculating the difference between solar maximum and minimum conditions. Simulations under both time-varying and fixed solar inputs show statistically significant responses in temperatures and winds in the Southern Hemisphere (SH) during austral winter and spring. At solar maximum, the monthly mean, zonal mean temperature in the SH from July to October is cooler (~1-3 K) in the stratosphere and warmer (~1-4 K) in the mesosphere and the lower thermosphere (MLT). In solar maximum years, the SH polar vortex is more stable and its eastward speed is about 5-8 m s-1 greater than during solar minimum. The increase in the eastward wind propagates downward and poleward from July to October in the SH. Because of increase in the eastward wind, the propagation of eastward gravity waves to the MLT is reduced. This results in a net westward response in gravity wave drag, peaking at ~10 m s-1 d-1 in the SH high-latitude MLT. These changes in gravity wave drag modify the wave-induced residual circulation, and this contributes to the warming of ~1-4 K in the MLT.
http://www.science.gov/topicpages/y/year+solar+cycle.html
LikeLike
Reply to TL Mango.
This is not a simple question that can be answered in a simple fashion.
Let’s be clear first about the thing we are talking about. There is an ascending circulation of ozone rich air on the margins of the cone of slowly descending mesospheric air that establishes over the Antarctic continent and extends into the mid latitudes in winter. In speaking of the vortex you could be referring to the descending part or the ascending part.
The ascending part is generated between 200 hPa and 50 hPa and constitutes the jet stream. In mid winter the speed of the circulation is greatest and it increases with increasing elevation from jet stream level through to 10 hPa. In other seasons the ascent is to lesser elevations and with less speed.
The descending part is a product of high surface pressure in winter and it can stall and be displaced, split into two parts and go into reverse mode when surface pressure falls away in winter. Surface pressure falls away as the ozone content of the air increases.
In my estimation the speed of the descending part will vary between March and December according to lots of circumstances the chief being surface pressure over the Antarctic continent. There is no internal descent between December and March. It gradually accelerates from March to August as polar surface pressure increases. The generation of the ozone hole via impingement of troposphere air rich in NO2 and NOx encircling the polar cap below 50 hPa circling inwards to occupy the entire cap and eliminate mesospheric air by September eliminates all vestiges of ozone and provides the greatest contrast in air density resulting in the annual minimum in surface pressure in September and October in the region of the circumpolar trough. That is promoted by a slowing of the internal descent as surface pressure over the continent gradually rises in spring.
So, the speed of the internal vortex and the external ascending circulation is going to depend on when and where you measure it. That said both circulations depend on:
1. Polar cyclone activity that is driven by density contrasts across the interface of two different parcels of air between 300 hPa and 50 hPa. That depends on the differences in the ozone content of the air across the interface between air masses spiralling in from the north and the air mass that is resident over the Antarctic continent.
2. Since the air is an electromagnetic medium it will be affected by all the circumstances that govern the behaviour of the atmosphere as weak plasma including the solar wind, the degree of ionisation of the atmosphere and its relative states of inflation due to ozone heating and also that due to short wave radiation from the sun. The atmosphere super-rotates in the same direction as the Earth to some extent imparting spin to the Earth itself via friction.
I imagine that as cosmic rays penetrate further when the atmosphere is warmer and it is warmest when the descending circulation is in a state of stall due to ingress of ozone rich air from the periphery, this being a time when the solar wind is weakest, the electromagnetic influence on the circulation will also be weak. However, as it results in the generation of ozone, cosmic ray activity will enhance the speed of the ascending circulation due to enhanced density contrasts; send more ozone rich air into the stratosphere, lowering surface pressure in high latitudes, further inhibiting the descent of mesospheric air. This is what we refer to as a sudden stratospheric warming. Its persistence is due to ozone enhancement due to cosmic ray activity.
Does this answer your question?
LikeLike
This would suggest that when the sun’s magnetic field is weak
and cosmic rays are abundant, both maximum production and
destruction of ozone would take place simultaneously.
All accumulated ozone must be created in the lag period just
prior to the vortex shutting down. Does any of this make sense?
LikeLike
Galactic radiation destroys ozone in winter in areas where the radiation is focused by the magnetic field of the Earth.

In the summer, thanks to the access of UV takes continuous production of ozone and increased temperatures in the lower stratosphere?
LikeLike
Ren, Can you give me the links to the background information that relates to these ozone graphs. I need to see heights. Its dealing with anomalies. I like to see the absolute concentrations in order to work out what is going on. What you must take into account is NOx from the troposphere, the most potent destroyer of ozone. But for that the maximum in ozone concentration would be at the surface and we would not be here to talk about it.
LikeLike
Sorry.
http://exp-studies.tor.ec.gc.ca/cgi-bin/dailyMaps?language=e&fsource=all&fday=all®ion=n
LikeLike
Ren I like this site for both ozone and NOx. If you choose Bascoe at 50 hPa, 3*3 mosaic every 10 days, southern hemisphere, date 2015-09-28 you will see NOx rich air take over the region of the polar cap creating the ozone hole. It is NOX that destroys ozone. I would have to be convinced that cosmic rays destroy ozone.
LikeLike
I cant see that cosmic rays destroy ozone. If these rays enhance ozone content they cant simultaneously destroy it. The main thing destroying ozone in high latitudes is chemical activity and in particular NOx from the troposphere and to a lesser extent NOx from the mesosphere.
LikeLike
When I ask “does any of this make sense?”
I’m asking if my ideas are ridiculous.
LikeLike
I need more detail to get to properly answer the question.
LikeLike
Rens reference says: The increase in the eastward wind propagates downward and poleward from July to October in the SH.
That’s another way of saying that the speed of the flow at 10hPa is greatest in July and diminishes as the final warming is approached. But as the contrast in ozone density across the circumpolar trough becomes more extreme towards September and October (ozone hole months) the speed of the eastward flow increases between 300 hPa and 50 hPa while the interface migrates pole ward.
So, that’s based on simulations rather than observation and they find a difference between solar maximum and minimum.
They say: “At solar maximum, the monthly mean, zonal mean temperature in the SH from July to October is cooler (~1-3 K) in the stratosphere”. This is consistent with lower ozone partial pressure due to diminished cosmic ray activity. It is also consistent with this comment:” vortex is more stable and its eastward speed is about 5-8 m s-1 greater than during solar minimum” That in turn means a stronger flow of ozone diluting air from the mesosphere. To complete the story we need to know whether the westerly winds at the surface are weaker or stronger because they drive the currents that bring cold water into the tropics and also more uplift of cold waters from the deep, all of which affects surface temperature.
LikeLike
Magnetic activity on the sun affects JETSTREAM. That is why El Niño in 2015, has not developed quickly since circulation was unfavorable. Similarly it is now with La Niña. Low solar activity (JETSTREAM) inhibit its development.


It is better to compare geomagnetic activity in 1998 and 2016.
LikeLike
Ren,
I need more explanation.
LikeLike
There are many issues to explain. One thing is certain, that low solar activity blocks JETSTREAM.
LikeLike
Thanks for your input ren.
I definitely overlooked ozone production due to UV.
I’m looking for evidence of an accelerating vortex with
a decrease in the sun’s magnetic field. Not just at the
11 year scale but also at longer time scales. This would
support my theories about the sun’s involvement.
LikeLike
Hi Erl,
When I say an abundance of cosmic rays would
maximize both production and destruction, I’m saying
that cosmic rays would increase production and an accelerated
vortex would transport more ozone to the area where it is
destroyed.
When the sun’s magnetic field re-strengthens the vortex
would slow or shut down. Large amounts of ozone would have
been produced in the lag time just before the vortex shuts down.
At least this is how I hope it happens.
LikeLike
TL Mango,
When you say an accelerated vortex would transport more ozone to the area where it is destroyed. Where would that be?
LikeLike
Erl in my opinion underestimated the role of the magnetic field of the Earth and generated by the solar wind. Ozone as a diamagnetic reacts to a magnetic field.
Also strong cosmic radiation enters the atmosphere through a hole in the magnetic field in the Atlantic. Thus, it is directed over the magnetic pole according to the lines of magnetic field. The strength of the magnetic field causes the differences in the distribution of cosmic rays.
http://www.esa.int/spaceinvideos/Videos/2016/05/Changes_in_strength_of_Earth_s_magnetic_field
http://www.esa.int/Our_Activities/Observing_the_Earth/Swarm/Earth_s_magnetic_heartbeat
LikeLike
Cosmic rays penetrate the atmosphere to a greater extent when it is warming. The neutron count at a particular place varies with the temperature of the air above that place and its elevation. So, neutron count is greater when the cold air above the pole is displaced by warm air as in a sudden stratospheric warming. Do we have enough neutron counters to work out the geographic distribution of neutrons at a moment in time and compare it to the circulation of the air? Undoubtedly the magnetic field affects the rate of ingress of neutrons because we know that when the solar wind is intense it diverts neutrons away from the Earth.
As for the distribution of ozone, that is determined by the natural centres of uplift….in the winter its warm ocean that gives rise to low pressure systems the notable instance being the North Pacific. Ozone is in greatest concentration at 50 hPa where it is relatively free from the pressure of ionisation. At 100 hPa its eaten up by NOx given off by soil and this gives rise to a higher tropopause in the northern hemisphere where there is lots of warm soil in summer.
LikeLike
To the outer perimeter of the vortex, where it would
come in contact with descending air from the mesosphere?
LikeLike
The inside of the vortex contains mesospheric air constantly descending. Its like a funnel with ozone rich air tipping in from the periphery where the air ascends. In meteorology people refer to ‘the vortex’ as the upward extension of the jet stream that creates the shape of this funnel of ascending air. There is an escape of mesospheric air across the vortex because it is rarely continuous. There are gaps where the air will be descending rather than ascending. That descending air is mesospheric, and from the mid latitudes resulting in the temperature being lower at 70 hPa than it is at 10 hPa. In the northern hemisphere a prominent gap is established in early winter over Siberia. Later, as the land begins to warm the centre of descending air moves more into the Arctic as surface pressure increases in that part relative to what it is over Siberia.
LikeLike
Thanks Erl,
By ‘vortex’ I was referring to both the inside descending and
the ascending periphery. I think I may be causing confusion by
approaching this from a different perspective. I’m not looking at
this in a seasonal time scale but in long time scales of hundreds
of years or more. When I speak about an accelerated vortex I’m
referring to an escalation of the whole transport process.
Cosmic rays are most abundant when the sun’s magnetic field is
weak. i’m interested in how the system will respond to massive
amounts of cosmic rays.
LikeLike
The response to increase in ozone (due to cosmic ray activity) in the middle and upper atmosphere is to accelerate polar cyclone activity, lowering surface pressure and by virtue of the loss of pressure over the Antarctic continent it weakens the descent of mesospheric air (that normally dilutes ozone) resulting in increased polar cyclone activity and further loss of pressure. The limits to the process are imposed by gravity. The process can not proceed to remove ever more atmospheric mass from high latitudes. Unless solar cycles further weaken we are at the limits of the process now. If they do weaken this process of shifting atmospheric mass from high latitudes will continue and strengthen but not by much more I would have thought. Antarctic surface pressure has fallen by 10 hPa over seventy years and the curve has been pretty flat since about 1998.
LikeLike
Good day,
I found your post to be quite invigorating.
In my humble opinion, I think that water vapor, and not CO2, is sort of the biosphere’s thermostat. While CO2’s concentration has been gradually creeping up, within a somewhat narrow band, throughout the last, say 200 years, water vapor levels do change with time, within a broader band and much higher values than CO2’s, on a daily basis and just about anywhere on earth. What makes water vapor more interesting is that it has both a cooling and a warming effect as well: water vapor, as a vapor behaves like a green house gas, but water vapor as ice particles, like in clouds, reflect incoming solar radiation, and thus has a cooling effect, during cloudy daylight. I say more interesting, meaning that no one has a full knowledge and understanding of what its net effect is. Additionally, as the biosphere’s temperature rises it leads to more water vapor in the atmosphere, due to the increase in evaporation: sort of a catch 22….
A couple of asides:
> I Understand that TSI is gradually decreasing as the sun ages; additionally, I don’t think that it is a certainty that TSI is constant, say on account of solar flares: where is the instrumentation to measure unequivocally the overall sun’s surface temperature?
> I understand that water vapor is the chief green house gas [it is said to account for about 70%], and not CO2.
LikeLike
Hi Ben,
Thanks for your interest and your comment.
I certainly agree that: “as the biosphere’s temperature rises it leads to more water vapor in the atmosphere, due to the increase in evaporation.”
It’s probably more important that as the temperature of the air increases its capacity to hold water vapor increases. Of course the atmosphere cools overnight, it is uplifted by cold air, it moves towards the poles and gets colder so in a sense the water gets condensed out of it with regularity but if its warmer in low latitudes, as it now is, it can certainly hold more water vapour. And the capacity to hold water vapour and a wider spread of more frequent precipitation as you suggest together with the energy required to evaporate it all helps to cool the surface.
So, if the increased carbon dioxide and the water vapour warmed the Earth due to back radiation one would see marked heating in those locations where the water vapour accumulates. Strangely we do not. In fact, the heating occurs at cloud level where water condenses releasing latent heat driving convection. In the tropics there is a much faster increase in temperature at 850 hPa than at the surface. When we survey the surface of the Earth looking for where and when temperature has increased the greatest increases have occurred not in low latitudes but in high latitudes where the moisture holding capacity of the air is least and in the middle of winter when the cooling effect of precipitation is greatest. It is in the tropics that the temperature of the near surface air has increased least.
Re: TSI, I am not saying it doesn’t vary. But it seems that the variation is so tiny that it makes no difference.
Warming due to greenhouse gas influence: No, that’s definitely not a factor that we need to consider. Look at the last graph. Does the greenhouse phenomenon take a holiday in December?
LikeLike
You are a true gentleman Erl. Ben seems to be where I was when I read your first chapter…now so much further down the track. Cheers.
LikeLike
Macca, I do try to be a gentleman but occasionally my equanimity is upset and I cant help myself, the testosterone rises and I have to take a swipe. https://notalotofpeopleknowthat.wordpress.com/2016/09/14/the-influence-of-cosmic-rays-on-the-global-circulation-of-the-atmosphere-and-surface-temperature/#comment-76104
LikeLike
And you have left them speechless for over a week, I see.
LikeLike
Macha, are you referring to my comment at HarryTodd.org?
LikeLike