This little dissertation is a response to an invitation to: Get involved to find out more about the role you can play in helping our community reduce carbon emissions, including: What is already happening on both a global and local scale to reduce carbon emissions and secure a climate resilient future. The economic, social and environmental outcomes in the Shire, if we do nothing and the development of local solutions and clear pathways for everyone to take action.
Dismaying.
The entire southern hemisphere has not warmed in the month of January for the last three decades. That’s conclusive. Either the back- radiation effect is operational, or it is not. The supposed greenhouse effect can’t take a holiday in January over an area as large as half the entire globe.
There is little that one can do to combat the ‘carbon pollution’ delusion that is constantly reinforced in the media. Evidence to the contrary is rejected out of hand, like water off a duck’s back. The media considers that anyone who wants to put a contrary point of view is a ‘nutter’, anti-science and anti-consensus. So, the tendency, and my normal response, is simply let the matter slide.
However, the people promoting this local initiative should at least be aware of what has happened to climate locally. The Cape Leeuwin lighthouse is situated on a promontory jutting out into the junction of the Indian and Southern Oceans at latitude 34° south. Few locations on the globe have 120 years of daily observations from a site relatively unaffected by urban warming and land clearing. Cape Leeuwin is such a site. Each day, the maximum and the minimum temperature is recorded.
Data for Cape Leeuwin comes from: http://www.bom.gov.au/climate/data/ . For an overview I have broken the data up into decades starting with 1897-1906. Since the concern is that the climate is warming, I will begin by examining the average daily maximum temperature.
The average daily Maximum temperature at Cape Leeuwin

The warmest and coolest months are picked out in different colours. Broadly speaking, the decadal average of maximum temperatures declined till the 1930s and increased thereafter, except for the months of December and January where the warmest decade was a hundred years ago in 1907-16. Furthermore, the February maximum in the last decade is only 0.19°C more than in 1907-16. The mooted greenhouse effect, supposedly due to carbon dioxide, is not evident in daily maximum temperatures in December, January and February at Cape Leeuwin. February is the warmest month. No need to take action here.
If we are concerned with the welfare of succeeding generations, we should bear in mind that the average daily maximum temperature at Cape Leeuwin, at 23° C, is not that favorable to photosynthesis, upon which all life depends. From that standpoint the daily mean temperature should be about 25°C and the daily maximum about 30°C.

Figure 1
Figure 1 shows that with the passage of a century the winter daily maxima are from half to one degree warmer, according to the month of the year, with the greatest increase in June. From a photosynthetic point of view this should be a matter for congratulation rather than concern. We know that grass grows poorly in the cold months.
Is there reason to think that the average daily maximum temperature is being forced in one direction or another due to the works of man?

Figure 2
In figure 2 The blue line records the difference between the warmest and the coolest decade. The difference is between 1 and 2°C depending on the month of the year. One might ask, does 2°C represent the carbon pollution effect? Is it 1°C? Is it just zero? Or has carbon pollution caused temperatures to fall in December and January?
The yellow line shows the temperature increase that occurred over the century to 2006. The increase over the century is less than the difference between the warmest and coolest decade. Given that relationship, it’s very likely that all the change that has taken place is just natural variation.
So, in terms of maximum temperatures, in Margaret River, in either summer or winter, there is simply nothing to be concerned about. Summer is not warming. Winter is warming and that’s good.
The bias towards warming in winter, particularly in June, July and August is curious. As I explain below, there is a good reason for winter warming.
The average daily minimum temperature at Cape Leeuwin

Broadly speaking the monthly minimum daily temperature fell over half the period and then rose to reach a peak in the last decade in every month but May, that reached its peak a decade earlier. In spite of the high temperatures of the last decade this pattern of change doesn’t align with greenhouse theory. The carbon dioxide content of the atmosphere has been steadily increasing for more than 100 years. Cooling in the middle of the 100 year period is not what would be expected.

Figure 3

Figure 4
Figures 3 and 4 reveal that the progression in the minimum temperature is different between summer and winter.
But hang on. There is an unusually steep increase in both the daily minimum and maximum temperature in the last decade. This might be a cause for alarm. Alarmists will point out that these years are among the top five or ten warmest years for the period of record, and rightly so. Some might even claim these are tipping points with runaway global warming to be expected next week or next year. So, I am going to investigate this in some detail.
Why Winter
I noted above that, within a season, be it summer or winter, the timing of the advance and decline in temperature is different from one month to the next. This complexity is due to constant flux in the forces that govern the planetary winds. A wind blowing from the equator is warm and moist, while a wind blowing from high latitudes is cold and dry. Your mother probably told you this when you were very young.
Wind blows from areas where surface pressure is high to areas where pressure is low. Surface pressure changes from month to month, and century to century. This is due to the ever-evolving exchange of atmospheric mass between high latitudes and the rest of the globe. This is most forceful in the winter season. Furthermore, the exchange of atmospheric mass is very much stronger in the southern than the northern hemisphere. At 50-60° south latitude, on the seaward margins of Antarctica, a necklace of polar cyclones has been intensifying and driving down surface pressure for more than seventy years, in fact for as long surface pressure records are available. These cyclones are most intense in September and October, driving surface pressure on the margins of Antarctica to its annual minimum in September and October, the months that we experience extreme wind speeds in the southern states of Australia. Neither your mother or the climate scientists of the IPCC will tell you this because they haven’t noticed it yet.
As surface pressure falls in and about Antarctica it rises at 15-40° south latitude via the simple exchange of atmospheric mass. This is the latitude where high pressure cells bring cloud free skies and warm sunny weather. This combination of increasing pressure in warm locations and falling pressure in cold locations intensifies the southerly flow of warm air increasing surface temperature across the mid latitudes, including Cape Leeuwin.
There are parts of the southern hemisphere where high pressure cells tend to be particularly strong, especially over the oceans to the west of the continents. But the relative strength of these cells changes over time giving rise to what climatologists recognize as the ‘Southern Oscillation’ and “The Indian Ocean Dipole’. This adds a complication so its a bit more difficult to work out which one of these high pressure regions is active at any particular time, especially if you have your attention focused on just one of them
Look now at the following graphs that show temperatures at Cape Leeuwin in the period 1976 to 2018. There is a major disturbance after 1998. Such a disturbance, lasting years, is not unusual. We can see that another disturbance occurred in the month of October between 1980 and 1985.

Figure 5
In figure 5 the disturbance can be seen to begin about the turn of the century. Notice the amplitude of the disturbance. It’s gyrations are greater in September than October.

Figure 6
Figure 6 shows that the disturbance is also evident in January and February but the crazy gyration in a single month’s temperature from year to year is less than September. The curve is smoother but the increase is greater. Note that the maximum temperature fell to about 23° C in the most recent years, less than the long -term average. There has been a marked cooling in summer temperature in Margaret River since 2012. Grape growers have noticed this.

Figure 7
Figure 7 shows that the disturbance also shows up in the Annual average of temperatures from January through to December. This data exhibits a step up in the minimum temperature after 1994 but because its annual data we cant tell whether it’s happening in summer or winter. Because it’s the minimum temperature we know it’s usually the temperature just after dawn.
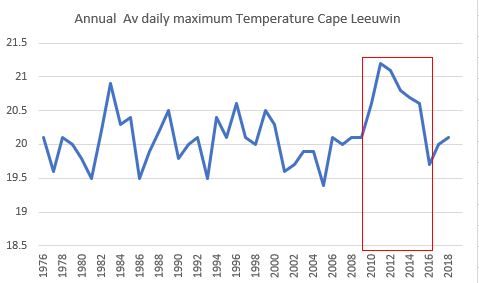
Figure 8
Figure 8 shows the same disturbance from the turn of the century is apparent in the average of the daily maximum temperature across all months but there is no step up in the maximum in 1984. So, the step up affects the minimum temperature and not the daytime maximum.

Figure 9
Figure 9 shows that the disturbance in the monthly temperature after the turn of the century was accompanied by a 25% reduction in rainfall in the April/May/June period. This decline began about 1988 and is most severe about 2007 after which rainfall has staged a partial recovery.

Figure 10
Figure 10 indicates that the decline in rainfall in the last half of the year happened after 1998. The decline is evident in July August and September, and also in the spring months of October, November and December. The decline is more obvious because it comes after a run of good years between 1972 and 1997 where rainfall was above average and, except for one very wet period, similar in amount every year.
In the last five years rainfall is almost back to the long-term average. It’s similar to the years 1907 to 1922.
Temperature change in the last 11 years at Cape Leeuwin
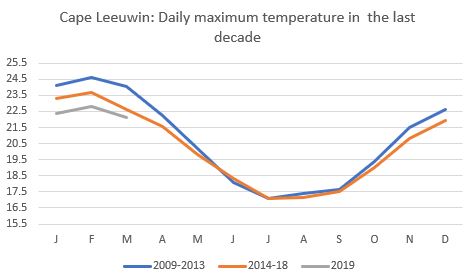
Figure 11

Figure 12
The five-year period from 2009-13 were some of the warmest months on record. The succeeding five years from 2014-18 have seen a steep fall in daily maximum temperatures. The 2019 growing season has been a nightmarishly cool for grape growers with the added disadvantage of rain in the ripening period. Along with low yields there has been extensive rot.
The cooling has occurred between December and March. People in the Cape to Cape region have noticed the change and are asking: Where have our summers gone? We used to be swimming at this time of the year. It’s been so cool. Evenings are too cold to sit outside. Where is the barbecues weather? A cold southerly seems to set in about 5 O’clock in the evening. We were set to go swimming but it’s now too cold.
Is there a possibility that this cooling trend will continue?
The Bureau of meteorology provides graphs that puts these recent years in perspective.


A dispassionate observer, looking at this data might observe that temperatures oscillate in the short and the long term. The longest-term oscillation appears to be longer than the number of years for which we have data.
Now we look at data for the average daily minimum temperature.


When I look at the daily minimum, I see a gradual warming. There is a definite upwards trend that is steeper as the summer wears on. We must be aware that the increase in surface pressure over time has reduced cloud cover and allowed more solar radiation to reach the ocean. I see this as part of a natural process. Its natural for the minimum to rise more towards the end of summer as the ocean gains heat.
We have to note that the minimum has risen less in January than in February and March.
The interesting thing is that the warmth gained in summer and more particularly in winter is not being carried forward to appear in the January maximum. So, the system sheds energy within the annual cycle just as it does overnight.
You can work out what this means for global warming theory for yourself.
Conclusion
Its apparent that the climate has changed and that this is not unusual.
In order to understand a phenomenon, we need to drill down to the detail. Climate change is not a simple phenomenon. It can affect night time temperature and not daytime temperature and the winter months more than the summer months. Unfortunately, few people are aware of the detail and are easily persuaded to take a simplistic point of view.
The likely explanation of variation in temperature is a change in the direction of the wind alternating between the ocean and/or low latitudes and the land and/or high latitudes. We are aware that is what gives rise to the day to day variations in temperature. What is not realized is that the forces that alter the direction of the wind change on all time scales. Prior to the ‘global warming scare, students of climate were aware of the ‘Arctic Oscillation’ between winds from the south and winds from the north that changed surface temperatures in over a period of thirty years or more. We now know, or should know, that the Antarctic Oscillation of the Southern Hemisphere is more powerful than the Arctic Oscillation. These oscillations are primarily a winter phenomenon. But they affect cloud cover and therefore the uptake of solar energy by the ocean. They drive changes in the ocean currents that bring cold waters to the tropics and warm waters from the tropics down the east coasts of the continents in the southern hemisphere. These changes take a long time to play out.
When we drill down into the detail, climate changes differently according to the month and season of the year. Plainly, surface temperature is not simply aligned to change in the carbon dioxide content of the atmosphere. Temperature is governed in the first instance by where the wind is coming from. Before we jump to conclusions, we should keep that in mind.
Here we are talking about the climate of a specific location in the southern hemisphere. But the same story applies to the entire hemisphere. My next post will cover that.
Policies designed to limit the generation of energy that adds to the carbon dioxide content of the air are based on a false premise. By increasing the cost of energy these policies erode disposable income, trash energy intensive industries and export employment to countries where energy is less expensive. By adding to transport costs these policies disadvantage everyone, none more so than in remote rural communities like Margaret River.
All intermittent sources of energy need to be backed up with sources that are available ‘on demand’. The latter must be built and staffed, and people paid to stand around while the sun is shining and the wind is blowing. That cost is paid, not by the provider of energy sourced from so called ‘renewables’, but by the taxpayer via subsidies, or the consumer via higher electricity prices.
To correct this misallocation of resources and put things aright, all subsidies and incentives should be removed, and energy providers engaged to provide power on a 24/7/365 basis, with penalties attached for nonperformance. That is what is expected of other producers of goods and services and it makes no sense to promote a specially privileged group of enthusiasts and enable them to escape their obligations.
Paradoxically, the argument for ‘sustainability’ although patently well meaning, is destructive in its effects on society. The clamor for action has reached fever pitch. Those of us with perhaps longer memories, perhaps we have just been around for a longer time, perhaps we have just learned to be more cautious, we are skeptical. Perhaps we feel the cold more acutely. It’s the oldies who go north in winter. We know what we like. We would like our summers to be a bit warmer.
The enthusiasm of youth is a great thing. It’s the source of revolutions. But revolutions sometimes run to excess.
Is this revolution well based? Have the hot-heads running this show been able to put their finger on what it is that worries them? Is it really the weather or something like the high price of land, the cost of housing, pressure to perform at school, the high cost of health care, the backpackers taking their jobs………..perhaps they don’t have a job? Perhaps they don’t have two parents at home? Perhaps their brains are addled by drugs and too much sex. Perhaps they just feel that they have lost their way and don’t know why, or what to do about it?
It’s vintage time. If I hadn’t fallen off a ladder, cracked a couple of ribs and needed to take it easy, this would not have been written

Jeez Erl, a ladder?!! Hope the healing is not too slow. But in some respects I am selfishly glad as it led to thus post. Please consider you might have a higher purpose. so well written,
Macha,.
LikeLike
Macca, you are a tonic. Feeling better already.
LikeLike
Erl, I just discovered your site via Chiefio’s Musings..
Ummm I’m glad I found you. Your thoughts and experience of the weather are along the lines I have been travelling here at Mt Barker in the Adelaide Hills of SA.. A big wine growing area by the way. So your post about yourself & vines was interesting also.
I tried to do an analysis of Mt barker’s weather since 1863 when BOM records started. It cna be seen here : https://www.facebook.com/groups/144702239734255/permalink/277479766456501/
By the way, get well ! take lots of Vitamin D3 and Vitamin K2 & magnesium citrate. At 72 those are the supplements I take to have strong bones. and recover from injuries.
LikeLike
Hey,
Great to get a message from a fellow Aussie farmer. I was in Mt Barker very briefly a year ago travelling between Kangaroo Island and the Barossa. Certainly a big town for the Adelaide Hills. Very much enjoyed the Hills, loving the wine and food emphasis. I commend you for the effort you have made to explore the data. It takes a lot of time but its infinitely more interesting than reading the paper. The media in Australia, and particularly the ABC has swallowed the global warming story and keep serving it up to us. Sad to see both main parties toeing the line in the Federal election. There are actual problems that we should be thinking about…….rather than fictional problems. Including the economy, the financial system, the fact that people on the minimum wage cant afford a house, the influence of the planning system on the supply of land, the housing bubble and what happens to borrowers when their house loses 40% of its value and they are still saddled with the inflated mortgage……lots of problems.
On the health front I enjoy oat porridge for breakfast with a teaspoon full of grape seed extract. Lots of antioxidants in grape seed and one of the best seeds is from Shiraz. I screened out the seeds from my own shiraz. I have a friend who is a cancer researcher with a focus on the prostate. He brought this to my attention. After gradually increasing despite the removal of the organ, the most recent PSA test indicates a decline.
Burning off here…got to go and attend to the fires.
LikeLike
Yes Mt Barker is a now big town. It’s on the Freeway to Adelaide so it has become a commuter town with 1300 ha now rezoned from farming to housing estates..Including across the road from me…Sighhhhh !
I am glad that you read that article I did on our own local weather/climate since 1863. I spent a couple of weeks trying to analyze the rainfall records as well.But my lack of computer skills made it a huge task and I gave up.
but my gut feeling is that the climate has not changed much at all in 160 odd years. Summers are usually hot & dry but occasionally we get rain in Summer. Winters are usualy cool & wet but some years are dryer than others and then temperature minimums are even lower due to frosty nights ( eg 2018 ! )
This year has been dry but overall not an extremely hot year like 2007-8 when we had heat waves ( 43 degrees ) in March.
And now roughly on time the ‘wet season’ ( ‘Cold Monsoon’ ) came 10 days ago and it is now Winter not Autumn.. Bloody cold & wet !
I reda your comment about Hobart weather station.. I will follow that up today. But what happened to the data for Cape Grimm ? If there is any ‘global warming’ it should show up on that data . It’s isolated from any major town ( or minor one ) so no UHIE. And there is only the Southern Ocean to the West of it…All the way around the globe to Argentina…
So I think the BOM is trying to suppress this data as it does not support their Global Warming ideology.
Email for direst contact : bhankin At adam.com.au
Bill
LikeLike
Hi Bill,
There may be other stations that have been recording data for a long period. Best bet to avoid the urban warming effect is probably a lighthouse.
LikeLike
Erl i just looked at the Hobart (Ellerslie Rd ) data as you suggested. The most significant change is in the the actual, the average & the medium Minimum temperatures.
As the city of Hobart has grown over the past 140 years the impact of Urban Heat Island has grown. It’s smack in the heart of Hobart now ! ( http://hobart-tas.street-map.net.au/ellerslie-rd/)…
What does the BOmmmake of this I wonder ?
I will post this on Chiefio as well.
Bill
LikeLike
Bill,
Have you analysed the change according to the month of the year?
LikeLike
Not yet..Too busy with family stuff here..
But my gut feeling is that the average minimum temperature has risen during the Winter months. That is what I saw in the BOM Mt Barker records. That’s a clssic UHI effect due to human concentrated use of energy ( petrol, gas & electricity, plus concrete buildings & tarred roads absorbing more sunlight and getting warmer. )
LikeLike
What have you discovered ?
LikeLike
Won’t get to this till at least the weekend. Busy bouncing around in a tractor seat.
LikeLike
🙂
Enjoy !
I miss the kubota and the newer Korean big bugger I had.
LikeLike