The long view of change in surface pressure (due to a redistribution of atmospheric mass) can be derived only from the reanalysis record located here and reproduced below. We look at change by the decade.

In the Arctic surface pressure peaks in March, April and May with a secondary peak in October-November due to ozone heating in the southern hemisphere. The fact that the Arctic peak occurs in March rather than in December-January relates to the presence of the Eurasian land mass where very cold conditions attract atmospheric mass in December and January. By March, the land mass warms slightly allowing a shift of atmospheric mass to the now relatively colder Arctic. However, surface pressure is most variable in January and February and this is when northern hemisphere surface temperature is most variable. I explore the nature of surface temperature variability here.
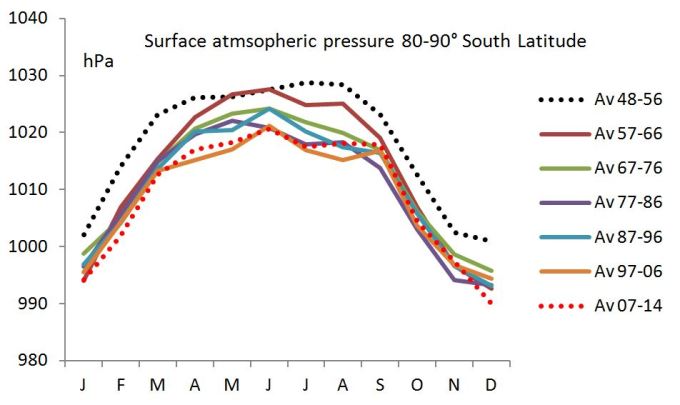
Above we see that, at the heart of the Antarctic continent, surface pressure peaks in mid winter. Winter surface pressure has declined by about 10 hPa over the period of record reflecting a an increase in the ozone content of the air that drives enhanced polar cyclone activity. The consequence is a gradual shift of atmospheric mass to other parts of the globe and in particular to the mid latitudes of the southern hemisphere where surface pressure has risen in direct response.
The westerly winds have strengthened over time as surface pressure falls in high latitudes and rises in mid latitudes.
Due to the increase in the strength of the westerly winds there has been a shift to higher latitudes of the band of cloud that is associated with frontal activity, consequent cooling in high southern latitudes in spring and early summer, an increase in Antarctic ice mass in winter and spring and change in rainfall patterns in the mid latitudes. West coast Mediterranean type climates that rely on winter rainfall have become more arid. However the increase in the carbon dioxide content of the atmosphere enables plants to thrive on less water and vegetative mass has actually increased despite the decline in rainfall as reported here and here. In some parts of Australia rainfall has increased.

On the margins of the Antarctic continent where the atmosphere is relatively rich in ozone, not so much in relation to the very high levels of ozone in the northern hemisphere but certainly by comparison with the air over the Antarctic continent, there is a marked trough in surface pressure in October when ozone partial pressure is at its seasonal maximum.
At 60-70° south surface pressure has declined by 10 hPa over the period of record. The secondary peak in January is due to ozone heating in the northern hemisphere.
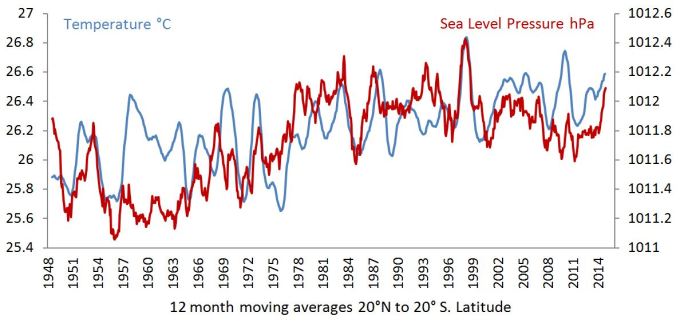
As the atmosphere moves away from high latitudes there is an increase in atmospheric pressure in mid and low latitudes. This is accompanied by an increase in the temperature of tropical waters between 20° north and 20°south latitudes as seen in the diagram below. In assessing this relationship we should not forget that volcanic eruptions can throw dust into the stratosphere increasing the Earth’s albedo. Secondly, the oceans absorb energy and give it up slowly so that surface pressure leads as temperature increases and leads again in the decline phase.
The rate of transfer of energy by the atmosphere from low to high latitudes increases as the pressure differential between the equator and the poles increases.
The system gains energy as surface pressure increases via a reduction in albedo in the mid latitudes as described here.
The decline in surface temperature in the tropics after 1998, as surface pressure falls away suggests that the system does in fact gain and lose energy according to change in albedo that is causally related to the surface pressure dynamic.
TEMPERATURE DYNAMICS 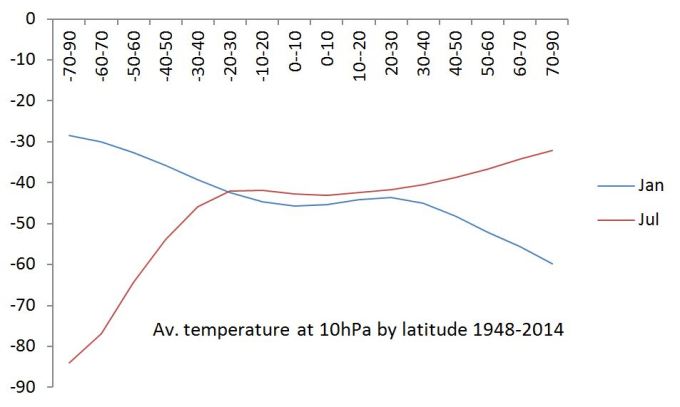
In high latitudes the wide swing in the temperature of the air between summer and winter reflects the influence of the vortex of mesospheric air with substantially increased inflows in Antarctica, much more so than in the Arctic. This is the dominant influence on the ozone content and the temperature of the Antarctic stratosphere and indeed the ozone content of the southern stratosphere.
CHANGE IN THE TEMPERATURE OF THE ANTARCTIC STRATOSPHERE AS OZONE HAS PROLIFERATED
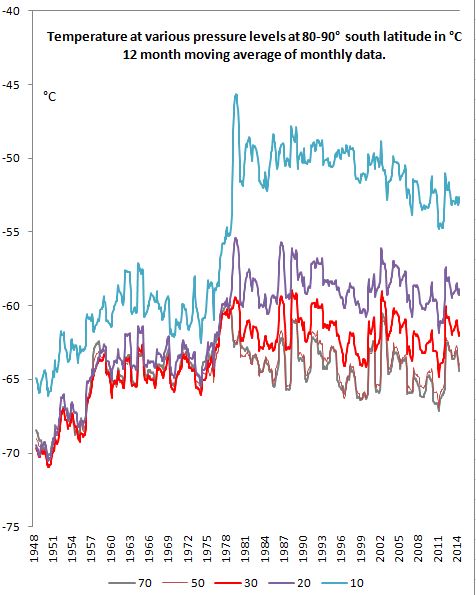
The change in the temperature of the stratosphere over Antarctica since 1948 reflects a change in the partial pressure of ozone in the air necessarily involving a change in the distribution of ozone at various pressure levels. Since ozone heats the air, it reduces its density and local contrasts in density result in ascent of the low density air, albeit mixed with air from the troposphere and from the mesosphere. The change in the mobility of the air changes the vertical distribution of ozone in the stratosphere. It is natural that the temperature of the air increases to a greater extent at the more elevated pressure levels because this is where ozone accumulates as a result of the process of uplift.
The explanation for ozone volatility given here is very different to the Brewer Dobson narrative that sees ozone being transported from the tropics to accumulate in high latitudes. In fact the circulation is in the reverse direction with whole of atmosphere ascent in high latitudes and descent in the mid latitudes.
The protective mechanism that allows the increase in ozone partial pressure in high latitudes in winter is the reduced incidence of destructive short wave radiation due to the longer atmospheric path as the sun sinks towards the horizon, disappearing entirely during the polar night. A secondary advantage that accrues in the winter hemisphere resides in the reduced uplift of NOx and water vapour from the lower atmosphere outside tropical latitudes.
The ozone hole in spring is a product of convection that brings destructive NOx into the lower stratosphere over the Antarctic continent where it is trapped by the still persisting descent of mesospheric air until November. The hole is not new. It was first encountered in 1956 when a Dobson Spectrometer was taken to the British base at Halley Bay in Antarctica but it was smaller at that time. Its enhancement is due to enhanced convection. Bear in mind the negative correlation between ozone partial pressure outside the ‘hole’ and inside the ‘hole’ indicating that the hole is a natural feature of the circulation rather than a product of ‘new chemistry’ that is a threat to the presence of ozone throughout the stratosphere. This dynamic and the very different situation in the Arctic will be covered with rigour in later chapters.
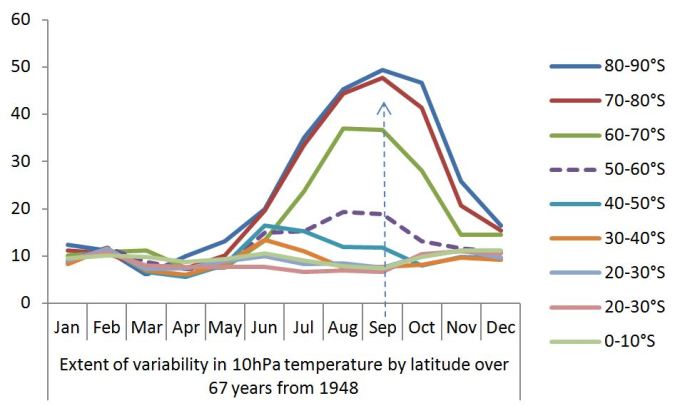
Below we see that the temperature of the air at 10 hPa vacillates most in October, the month when the ozone hole manifests in the lower stratosphere. This is also the month when surface pressure descends to its annual minimum at 60-70° south latitude due to the contrast in ozone partial pressure on either side of the chain of polar cyclones that is generated as a result of the density differential. The increase in the temperature of the polar cap in October represents ozone enhancement over time. With enhanced partial pressure of ozone aloft there will be a commensurate tendency for descent in the mid latitudes in October/November that is very much part of the ENSO dynamic. The trough in surface pressure at 60-70° south in October adds atmospheric mass to the mid latitudes expanding the area occupied by relatively cloud free high pressure cells. Together these influences add an El Nino bias to the climate system.
This increase in atmospheric ozone in springtime and lack of depletion at any other time of the year flies in the face of the many ‘ozone at risk’ narratives that have been foisted on an unsuspecting and compliant public by attention seeking ‘scientists’ over the years.

The diagram below records the degree of variability in 10 hPa temperature by latitude in the southern hemisphere over the period since 1948. The data represents the difference between the coolest and warmest month within the period.It is plain that extreme variability is associated with the months when the Antarctic ozone hole develops in the period from June through to December.
CHANGED TEMPERATURE PROFILE IN THE MID LATITUDES OF THE SOUTHERN HEMISPHERE INVOLVING A WARMER UPPER TROPOSPHERE
In the mid latitudes the strongest winds manifest between 300 hPa and 50 hPa where cyclones and anticyclones are characterised by marked differences in their ozone content. The increase in the temperature of the air in the mid latitudes at 200 hPa in 1976-78 is associated with increased surface pressure. The increase in the temperature at 200 hPa relates to the increase in the temperature of the stratosphere generally.

SOURCES OF VARIABILITY IN THE PARTIAL PRESSURE OF OZONE IN THE STRATOSPHERE
1. The rate of influx of ozone deficient mesospheric air over the southern pole is surface pressure dependent and is the primary factor affecting the ozone status of the entire stratosphere. Stronger descent of mesospheric air is primarily a winter phenomenon. Even so, when surface pressure falls away at any time of the year the mesospheric tongue retracts and the stratosphere is seen to warm as ozone rich air takes its place. The most energetic changes are associated with the build up in ozone partial pressure from June through to October. Enhanced variability in spring is due to the relationship between ozone content of the atmospheric column and surface pressure. This relationship was well appreciated prior to the 1950’s. It has been ignored since that time. Ozone acts as a multiplier and an accelerator for surface pressure change originating from external influences.
2. The degree of uplift of NOx from the troposphere is plainly a potent influence on the ozone content of the stratosphere, especially in low latitudes but also over Antarctica in spring.
3.The manner of the accumulation of ozone in the northern hemisphere, and land/sea geography create a very different dynamic to that in the southern hemisphere. The singularly ozone rich air from the Pacific sector rises in the atmospheric column like a nuclear dust cloud, warming the stratosphere above 30 hPa. Changing pressure dynamics shift the high pressure cells that tend to locate over east Asia in early winter to the Arctic in spring, or alternately to the Scandinavian or the Hudson’s Bay/Greenland sector. The mesospheric vortex brings cold air to the surface where it streams southwards, particularly in the negative phase of the Arctic Oscillation associated with high surface pressure over the Arctic. In other words, the vortex in the northern hemisphere, unlike the southern hemisphere, has no fixed address. The Jet Stream wanders accordingly.
3. The composition of mesospheric air that is introduced into the winter stratosphere would be expected to vary with solar activity and in particular the partial pressure of the oxygen hungry products of the disassociation of nitrogen.
4. The density of mesospheric air and the upper atmosphere in general varies with the intensity of ionising short wave solar radiation probably affecting the effective rate of interaction between the mesosphere and the stratosphere.
5. The electromagnetic properties of the solar wind are known to impact the distribution of the atmosphere that has its own electric and magnetic field. Ozone is diatomic and will react to electromagnetic stimuli. The atmosphere over the pole is particularly susceptible to movement when the stratosphere is warm because cosmic rays (charged particles) penetrate to greater depth at that time. At times when the aurora light up the heavens under the pressure of the solar wind, the atmosphere is likely to be very responsive to electromagnetic stimuli.
6. Ionisation due to cosmic rays may be involved in the synthesis of ozone at the poles.
It is apparent that all these factors place conditions on the extent to which the sun drives shifts in atmospheric mass that are comprehensively amplified by the Earth system itself. The chief deterministic condition as to the scope of influence of external influences and the manner of their expression is the susceptibility of the winter hemisphere rather than the summer hemisphere due to ozone enhancement in winter.
A SUMMARY OF THE ORIGINS OF NATURAL CLIMATE CHANGE
Ozone proliferates in the winter hemisphere, probably due to the manner in which the wave lengths that are responsible for the photolysis of ozone are attenuated as the angle of incidence of the sun moves away from the vertical, especially in winter.
The inflow of mesospheric air that depletes ozone varies with surface pressure and is strongest in winter. In winter, stronger contrast in air density drives the generation of polar cyclones and enhances the jet streams.
Polar cyclone activity drives variations in surface atmospheric pressure shifting mass to and from high latitudes towards the mid latitudes and across the hemispheres. This changes the planetary winds and affects cloud cover in zones of high surface pressure via the well observed relationship between surface temperature and geopotential height at 500 hPa.
Hypothetically the solar wind (geomagnetic activity) acts as a trigger for change and establishes an equilibrium about which the climate system oscillates. The climate system itself provides a strong amplifier to change in surface pressure initiated by an external source because any reduction in surface pressure in high latitudes promotes further loss of surface pressure per agency of ozone.
The signature of polar processes affecting the ozone content of the air is written in the surface temperature record. Temperature changes according to the origin of the air in a manner that is well documented as the Arctic and the North Atlantic Oscillations of the northern hemisphere. The El Nino Southern Oscillation is a surface pressure driven phenomenon waxing and waning with the strength of the Trade Winds. It reflects change in the rate of mixing of very cold waters into the warm waters of the tropical Pacific and the rate at which warm waters from the tropics are driven towards higher latitudes. In other words, the temperature of the surface waters is by and large a result of change in the nature of the water that is present, much like the change that occurs when a person dons new garments. Things seem to change at the surface but underneath there is no change at all. But in the case of the Earth system there is actually a change in cloud cover outside the ENSO monitoring regions as surface pressure falls in high latitudes. It is predominantly in the mid latitudes over the oceans where high pressure cells naturally form that cloud cover is affected. Cloud cover falls away as atmospheric mass shifts to the mid latitudes strengthening the pressure differentials that drive the planetary winds.
The signature of natural climate change, the only game in town, is written into the surface temperature record. It is tied to shifts in atmospheric mass.

Erl,
In your illustration showing temperature at various pressure levels at 80-90 deg Sth I was struck by the speed of change around 1976 to 1978. As far as I can tell the Great North Pacific Climate Shift that occurred about this time has never had a a convincing explanation. Could it be related to this abrupt transition over Antarctica?
LikeLike
Absolutely. I know of no other rationale.
LikeLike
That spike is most clearly identified at 10hPa and happened in 1979. That looks like strong evidence of an extra-terrestrial driver. Probably of solar origin.
PDO change was in 1975. Backwards causation is always difficult to argue. My initial response would be absolutely not unless the causation can be put in the right order. But that step change also affected lower levels and is worth follow up .
LikeLike
The change has its greatest magnitude in September. In terms of mechanics it represents a big step down in surface pressure over the pole. It represents an earlier transition to the ‘final stratospheric warming that establishes the summer wind pattern that has the wind at 10 hPa flowing east to west rather than west to east. That represents a reduced intake of air from the mesosphere. This is in conformity with increased polar cyclone activity lowering atmospheric pressure south of 50° south thereby shifting atmospheric mass to the mid latitudes. The question arises: What causes the loss of surface pressure in high latitudes. What causes increased polar cyclone activity. What causes a more extravagant difference in air density across the polar vortex. Put another way, what causes the isobars showing surface pressure to crowd closer together across the latitude band 55° south to 75° south. What causes the differential pressure between the mid latitude high pressure cells and the low pressure zone at 60-70° south latitude to double so that the north westerlies blow twice as hard?
This change affected the surface winds globally. The mechanism?
LikeLike
I have not really tried to build into my mind the entire picture you revealing on a step by step basis. Nevertheless there do seem to be all sorts of connections between events. The term used in geological, paleoclimate and paleoceanography circles is “teleconnection”. In other words the connection between events that occur simultaneously but separated by large distances. Sometimes the effects are like long distance mirror images. For instance wetter or colder in one place but simultaneously drier or warmer in another. There is an apparent connection but the mechanism or means of communication is somewhat uncertain. The interaction between ozone, the processes that produce and transport ozone and the processes that destroy ozone may be contributing to the so-called teleconnections that are observed on both short-term (weather) and long-term (say 1000 yr) scales. Certainly plenty of food for thought here. Thanks Erl.
LikeLike
HI Rob,
Are you familiar with the notion of the ‘annular modes’.
LikeLike
It is interesting to note differences in the NOx uplift between Arctic and Antarctic, the latter seemingly more stable due to being in concert with hemispheric convection patterns arising from less land-ocean interfaces. So the southern hemisphere is more predictable because its dominated by ocean with its hugely stabilising heat capacity. The northern hemisphere is has a larger mix of land-ocean so convection has a more random pattern. Convection is the Mass and energy transporter, manifest as wind and an unstable vortex. Imagine our climate without strong winds ie mild convection.
LikeLike
Macha, You are getting the idea. Indeed there is a massive difference between the pattern and the evolution of surface pressure in the two hemispheres entirely due the difference in the distribution of land and sea.
LikeLike
I’ve been considering how to experiment on the uplift of cold air from lower altitude by mixing with warmer higher pressure air from above. Two bottles might suffice, but I need ideas on how to make the top one visible i.e. coloured. Brett Keane, NZ
LikeLike
Hi Brett, So far as getting that cold air to move upwards is concerned its a function of the size of the engine above. Have you had a look at this: https://reality348.wordpress.com/2016/01/11/5-the-enigma-of-thecold-corepolar-cyclone/
LikeLike
The air coloured, that is.
LikeLike
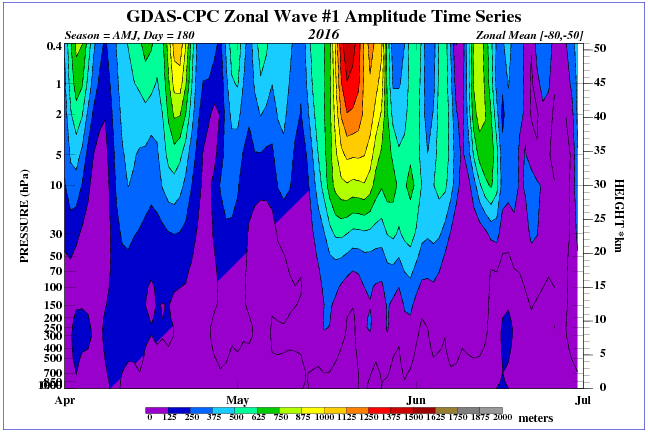
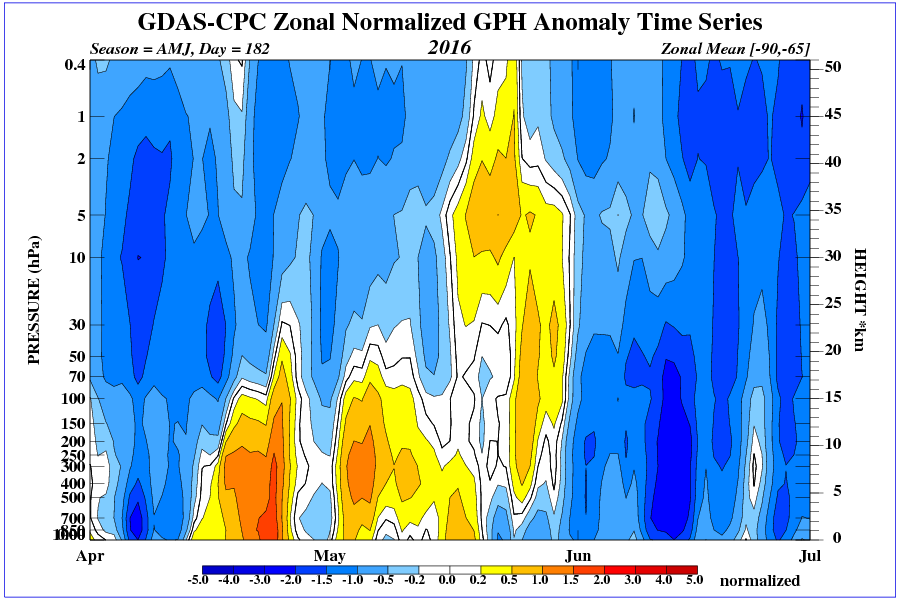
There is a wave in the stratosphere and the pressure anomaly to the south.
LikeLike
Ren, the presence of a positive GPH anomaly between the surface and 100hPa is due to an increase in the rate of descent of ozone rich warm air at this level. This is due to an increase in surface pressure over the pole that is associated with the establishment of a stronger inflow of mesospheric air that is part of the winter pattern. The upper stratosphere has been rapidly cooling since January as seen here: http://www.cpc.ncep.noaa.gov/products/stratosphere/temperature/01mb6590.png Its now getting much cooler at 70 hPa (but with much more cooling to go) as seen here: http://www.cpc.ncep.noaa.gov/products/stratosphere/temperature/70mb6590.png
At the same time, there is an increase in the concentration of ozone in the atmosphere surrounding Antarctica that can be seen here: http://macc.aeronomie.be/4_NRT_products/5_Browse_plots/1_Snapshot_maps/index.php?src=MACC_o-suite&l=TC
What we see is the establishment of the winter pattern. Despite the strong flow of mesospheric air in winter it can be interrupted. When surface pressure rises the flow of mesospheric air into the stratosphere over Antarctica will slow, the air will warm and allow more neutrons to descend to a lower level. In April only the upper stratosphere has cooled to its winter minimum so the change in the flow that changes temperature is only possible at the highest elevations.
High surface pressure over Antarctica can be seen here:
http://earth.nullschool.net/#2016/04/20/2100Z/wind/isobaric/250hPa/overlay=mean_sea_level_pressure/orthographic=-0.16,268.69,410/loc=72.280,-83.168
Do you agree with this interpretation?
LikeLike
AAO

LikeLike
Zonal wave.

LikeLike
GPH anomaly.

LikeLike
South Pole Neutron Monitor
Real-Time Data
http://neutronm.bartol.udel.edu/realtime/southpole.html
LikeLike
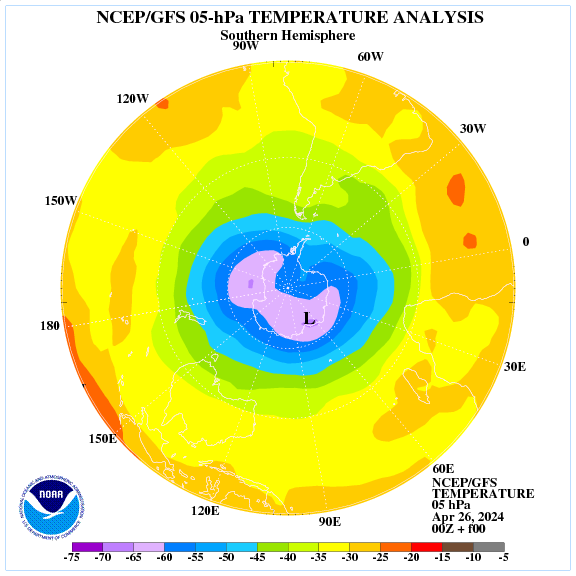
Erl look at the temperature distribution.
LikeLike
Yes, very cold over the pole. Greater inflow of mesospheric air above 10hPa. Increase in general downwards movement throughout the atmospheric column. So, cooling at the top of the column (mesospheric air) and warming at the bottom (ozone rich stratospheric air descends).
LikeLike
It is a shift in the direction of South America, where the magnetic field is weaker.
LikeLike
Erl
http://www.cpc.ncep.noaa.gov/products/precip/CWlink/blocking/real_time_sh/real_time_index_nrm.shtml
LikeLike
Total Field Intensity

LikeLike
Ren,
Thanks for the link to the blocking low and the total field intensity. I will include as pages to watch.
Have you comments on the total field intensity?
LikeLike
Erl
http://www.esa.int/Our_Activities/Observing_the_Earth/Swarm
LikeLike
I. While introducing “annular modes” The hand-waving clearly indicates no understanding of the mechanically induced “polar cells” their generation and how vastly different the northern and southern cells are including velocities and mass movement therein.
2. The idea of mesospheric atmosphere ‘cooling something’ is right from the terlet! If all the airmass of the mesosphere were dumped on surface of Antarctica the temperature would change by no more than 0.2 °C. Not only is there no measurable mesospheric vertical mass motion, the claim clearly lacks any understanding of the difference between temperature and sensible heat.
3.The claim that stratospheric Ozone, O3, causes any of this is also straight from the terlet! Ozone appears to collect near the stratospheric poles, only because at these locations the stratosphere is still moderately dense but the temperatures are low enough to inhibit the oxidation by O3 of N2 producing atmospheric NOx almost as fast as it is produced near tropical latitudes.
4. The title suggests that the Earth’s airmass redistributes latitudinally monthly. No such redistribution is measurable and even sea level pressures stay within 0.4% of the average 101,325Pa!
These off the wall fantasies are much more damaging to atmospheric understanding than is the deliberate CO2 SCAM! Please review the existing measurements that ‘falsify’ your claims, rather than only learned peer reviewed nonsense that agrees with your fantasy.
LikeLike
Good morning Will,
Gordon Dobson invented his instrument to measure total column ozone in the 1920s. He was interested to work out why wind strength increased with elevation to the 100 hPa pressure level or thereabouts. Dobson had laboriously tracked the passage of clouds and balloons at different elevations in order to compare wind strengths. He was aware of the work of De Bort who had sent several hundred balloons aloft near Paris and discovered in the process that the point where the temperature stopped falling with elevation was a couple of kilometres lower when surface pressure was lower than when surface pressure was higher.
When he started measuring total column ozone Dobson discovered that his ozone data mapped surface pressure. Specifically, there was commonly a 20% difference in total column ozone on the margin of a high pressure cell than at its core. Extrapolating between his observations of total column ozone across Europe he drew a map showing total column ozone and it looked very similar to the weather map that we are familiar with based on lines of equal atmospheric pressure called isobars.
Low pressure cells originate in high latitudes as polar cyclones. Near the surface, the air is cold and dense. Based on the density at the surface we would expect low surface pressure. The facts are otherwise.
High pressure cells originate in the mid latitudes where the air is warm and therefore relatively lower in density, at least near the surface. But it is an different matter aloft because the air has little ozone, it is not warmed by the activity of ozone in absorbing radiation from the Earth at 9-11 micrometres. So that air is relatively dense. The upshot is more molecules in the atmospheric column or in other words higher surface pressure.
This is the reason for the lower tropopause above low pressure cells that De Bort observed.
If one examines annual temperature profiles in the atmosphere in the mid latitudes we find that ozone causes the air at the tropopause to be warmer in winter than it is in summer showing that the air at this level is warmed by something other than the surface of the planet. The reversal of the temperature profile to create a winter maximum begins at about 300 hPa (8km) a full 7 kilometres below the tropopause at 100 hPa (15km)
So, surface pressure depends directly on the ozone content of the air. That ozone is in the upper half of the atmospheric column from about 6-8 km in elevation. If one inspects ozonesonde data across the globe ozone partial pressure peaks at 16-17km in elevation but there is a marked variation on a day to day basis as the pressure cells migrate from west to east. That partial pressure peak is located at about the 70-100 hPa pressure level that happens to be the position of the tropopause over the equator. The lapse rate of temperature with elevation below the tropopause is about 6°C per kilometre but in practice its less wherever there is ozone. At the poles its less than 6° per kilometre at all elevations because ozone is present throughout the atmospheric column.
What is the agent responsible for this heating that drives the lapse rate below 6°C Will, and where is the energy coming from?
Check the ozonesonde data for yourself here: http://www.esrl.noaa.gov/gmd/ozwv/ozsondes/
Your points above:
Re1. Your idea that polar cyclones are mechanically induced is absurd.
Re 2. Mesospheric air does not cool except via the fact that its present, its very cold and its mixed into warmer air. Its presence during winter can be inferred by the fact that the annual range of temperature at 70hPa is much greater than at the surface with the big difference in winter, the complete lack of moisture by comparison with the surrounding air and the relative ozone deficit by comparison with the air on its margins.
Re 3. I struggle to find any meaning in what you say.
Re 4. The redistribution of the earth’s atmosphere due to the flux of ozone in the air and its effect on atmospheric density in the upper half of the atmospheric column and in turn the generation of polar cyclones that collectively determine the proportion of the atmosphere that resides polewards of 50° of latitude is something that you just have to come to terms with Will. Its something that is measured in various ways including what you see here: http://www.cpc.ncep.noaa.gov/products/precip/CWlink/daily_ao_index/ao_index.html
You should have a close look at the data here: http://www.cpc.ncep.noaa.gov/products/stratosphere/strat_a_f/
There is a very close relationship between the ozone content of the air, its temperature and what is termed geopotential height that represents the height of a pressure level. The height of a pressure level depends on atmospheric density below the point height that is strictly a function of temperature.
People don’t put satellites up to measure the ozone content of the air and its temperature just for fun Will.
Now, if you want to conduct yourself with some decorum rather than talking in terms of ‘hand waving’ and ‘off the wall fantasies’ you will get an answer from me. I guarantee it. Otherwise not.
LikeLike
erl happ says: May 16, 2016 at 7:18 am
“Good morning Will,”
Good morning!
I will ignore you new egregious claims of what O3 may or may not do! But you did respond to my presentation thank you!
“The lapse rate of temperature with elevation below the tropopause is about 6°C per kilometre but in practice its less wherever there is ozone.”
The committee specified mid latitude temperature lapse, -6.5°C/km is used ONLY for calibrating aircraft barometric altimeters, such that all aircraft at the same location and altitude indicate the same altitude, independent of the actual altitude, pressure, and temperature. #3 for reducing aircraft mishaps. This lapse rate has no other significance, or occurrence anywhere on this planet!
Earth’s lapse rate has lowest magnitude -5°C/km near the equator or seasonal ITCZ. Atmosphere here remains H2O saturated all the way to 18km. There exists at about 30° latitude a -9.8°C/km lapse rate where dry atmosphere descends under gravitational compression, in the north, the sahara/sahel. More poleward lapse rate goes to approximately 6°C/km at 60° latitude. Lapse rate can exceed -10°C/km at either pole in winter.
“At the poles its less than 6° per kilometre at all elevations because ozone is present throughout the atmospheric column.”
By whom and when was such an absurd claim ever measured?
“What is the agent responsible for this heating that drives the lapse rate below 6°C Will, and where is the energy coming from?”
Isolation evaporating the always airborne 2.7 cm column water condensate provides 2,500 Joules/g of energy. This is sufficient to oppose any reduction in temperature of the airmass as that WV re-condenses to water condensate, upon elevation or drift poleward.
“Your points above:
Re1. Your idea that polar cyclones are mechanically induced is absurd.”
Please go explain that to the engineers at JPL and Cal Tech, who actually attempt to understand this atmosphere, while freely admitting that they do not know!
As I wrote, the Computational fluid dynamics of the Earth is in place. The physical scale model of a rotating sphere, with instrumentation, is operational. Some of the computations can be physically verified by the physical model.
Without gravitational compression, nor asymmetrical heat application, the spinning physical models spontaneously generate from equator to pole circular convection patterns, similar to those observed and measured on this Earth. This verifies the prediction of the CFD atmospheric model under the same limited environment! Call that “ABSURD” at your peril!!!
“Re 2. Mesospheric air does not cool except via the fact that its present, its very cold and its mixed into warmer air. Its presence during winter can be inferred by the fact that the annual range of temperature at 70hPa is much greater than at the surface with the big difference in winter, the complete lack of moisture by comparison with the surrounding air and the relative ozone deficit by comparison with the air on its margins.”
Blah dada blah dada blah! Calculate the total thermal mass of the mesosphere. Mix that with a mere 1 meter thickness of the the atmospheric surface mass within 20° latitude of either pole. How much does that temperature decrease? Is such even measurable?
“Re 3. I struggle to find any meaning in what you say.”
🙂 Ask nicely and I can explain further, but only if YOU are willing to merely consider the POV of any other!! I do not ask that you accept, but only consider. Your opinion of this is as good as mine. Such differences in opinion may never be resolved, and there is no reason that they should be.
“Re 4. The redistribution of the earth’s atmosphere due to the flux of ozone in the air and its effect on atmospheric density in the upper half of the atmospheric column and in turn the generation of polar cyclones that collectively determine the proportion of the atmosphere that resides polewards of 50° of latitude is something that you just have to come to terms with Will.”
For someone unable to determine the amount of atmosphere, you claim vast knowledge of at what latitude it may be.
“Its something that is measured in various ways including what you see here: http://www.cpc.ncep.noaa.gov/products/precip/CWlink/daily_ao_index/ao_index.html”
How does this indicate the amount of atmosphere at any latitudinal volume, or mass?
LikeLike
“People don’t put satellites up to measure the ozone content of the air and its temperature just for fun Will.”
Earthlings such as Erl Happ have never accomplished anything! Some engineers plus many bucks of investment do design then launch satellites that attempt to measure somepthing. For me it was 4.6 years of struggle to figure out what the hell this puppy might be measuring! Currently that remains state of the art. Only Banksers, Scammers, and of course Politicians claim measurement.
“Now, if you want to conduct yourself with some decorum rather than talking in terms of ‘hand waving’ and ‘off the wall fantasies’ you will get an answer from me. I guarantee it. Otherwise not.”
Why would anyone accept a guarantee from ERL HAPP?
LikeLiked by 1 person