
Source of data above:http://www.esrl.noaa.gov/psd/cgi-bin/data/timeseries/timeseries1.pl
When I started looking into atmospheric matters back in 2008 and I discovered that the temperature of the Antarctic in mid winter at 10 hPa had jumped in the 1970’s as the atmospheric pressure at the surface took a plunge it started me on a search for answers. This post tells you what I have discovered as a private self funded researcher seven years on.
The cold core polar cyclone
The ascent of the air at the core of a polar cyclone is a mystery because the near surface air in a polar cyclone is cold and dense. Polar cyclones form in high latitudes where the surface and the air in contact with it is very cold. Air that is cold and dense should not ascend. The unsatisfying explanation that is offered in the meteorological literature has to do with fronts between cold and warm air and the Coriolis ‘force’. But the Coriolis ‘force’ is not a force at all. It explains the direction of rotation and has nothing to do with the force responsible for uplift or down-draft.
Anticyclones form in the mid latitudes where the surface is warmer than in high latitudes. This is the case despite the fact that anticyclones form over water that is relatively cold for the latitude, located on the eastern margins of the oceans. Anticyclones also form over cold land masses in winter. To take the land based anticyclone out of the equation we can examine the summer hemisphere.
It is now possible to examine the atmosphere in real time and toggle back and forward to look at it as on some day in the past. It’s animated too which is a real help. You get spot values at the click of your mouse. This is a fantastic resource for a student of the atmosphere. Find it at: earth.nullschool.net.
First, sea surface temperature. Observe that the eastern margin of the Pacific is cooler. The ocean moves clockwise, driven by the winds.

The day I have chosen is the first day of September 2015. We will stick to this single day throughout.
Below we have atmospheric pressure with an overlay of wind at 1000 hPa.
The lines indicate the circulation of the winds. Three tropical cyclones manifest south of a large high pressure cell. The high has a central pressure of 1030 hPa. Cold core Polar cyclones are also in evidence associated with zones of low surface pressure in high latitudes. The air circulates in an anticlockwise direction around cyclones and a clockwise direction around anticyclones.

The map below shows Wind Pressure Density at 1000 hPa (close to the surface) in terms of kilowatts of wind energy per square metre. Tropical cyclones are powerful systems but the energy is generated very close to the core and has little lateral spread . By contrast the cold core polar cyclone shows a fraction of the energy that is generated in a tropical cyclone and the energy manifests remotely, and in particular over the oceans rather than the land.

At 850 hPa (1000 metres) the energy attached to a cold core polar cyclone manifests over both the land and the sea.

The map below shows air temperature at 850 hPa (1000 metres). Shades of green represent temperatures above 0°C . Shades of blue indicate temperatures below 0°C. It is apparent that the air in cold core cyclones at 850 hPa is close to 0°C, while the air in the major anticyclone rejoices in a temperature of 12°C, well below the 24°C that is the temperature of the sea surface only 1000 metres below.

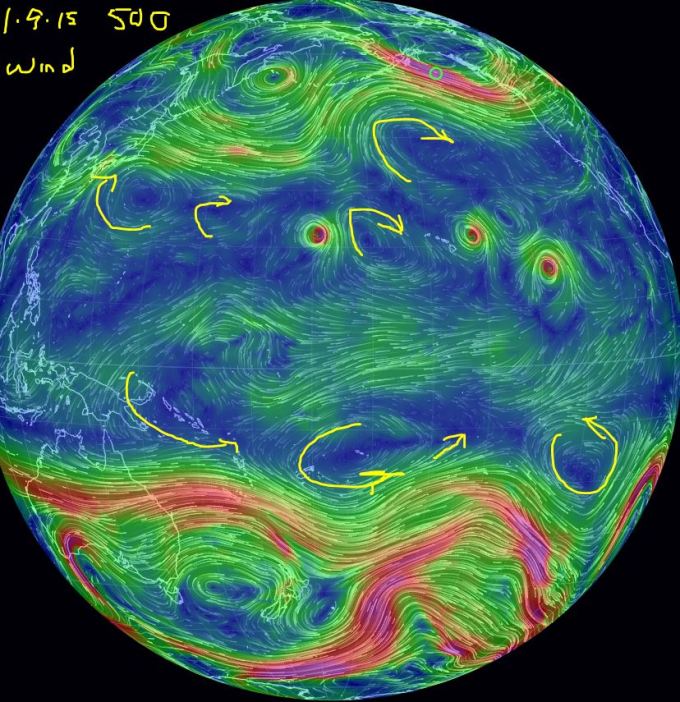
Below we have the temperature of the air at 500 hPa, roughly 5.5 kilometres in elevation with half the atmospheric column below and half above. All temperatures are sub zero. At its heart the anticyclone has a temperature of -5°C while the cold core cyclones have central temperature between -24 and -35°C.

Below again: There is a marked increase in wind pressure density on the outer margins of cold core cyclones at 500 hPa. But each polar cyclone conserves a relatively extensive core where the horizontal vector in the movement of the air is slight and we can infer that the vertical vector is pronounced. These cold core cyclones are now immensely more powerful and extensive systems than tropical cyclones.

At the 250 hPa pressure level, about 9 kilometres in elevation, extreme wind speeds manifest on the outer margins of cold core polar cyclones while the cores of vertically ascending air are extensive.

Below, we see that at 250 hPa the ascending air in the core of a polar cyclone is warmer than the the rapidly rotating air that surrounds it.

So, we see that at 9 km in elevation a polar cyclone has a warm core. The laws of physics are not flouted by the ascent of relatively dense air that is somehow magically displaced upwards by air of lower density. It is the power generated aloft that pulls denser air into the system from below. In effect we have the engine attached to an extraction fan above, a pipe extending towards the surface, narrowing as it does so, sucking dense air into the upper atmosphere. This is like a vacuum cleaner that sucks in cold air and pushes out hot air. At 250 hPa just 25% of the atmosphere is above and 75% below. Somewhere between the 500 hPa and the 250 hPa pressure level (5.5 km to 9 km) sufficient energy is imparted to the atmospheric column within these polar lows to reduce the lapse rate of the air with increasing altitude to the point that the air within these polar cyclones becomes relatively warmer and less dense than the air that surrounds the core.
Gordon Dobson who invented the spectrophotometer to measure total column ozone in 1924 very quickly discovered that ozone mapped surface pressure with more ozone in the atmospheric column of low pressure systems than in high pressure systems. De Bort, the Frenchman who put more than 500 balloons into the atmosphere around 1900 discovered that the air became warmer in cells of low surface pressure at a lower elevation than in high pressure cells. Both gentlemen were independently wealthy private researchers who considered that the science of their day was not settled.
There should be no mystery as to the cause of this phenomenon. Once initiated, the system gains momentum by virtue of the fact that the air that is being elevated is warmer that the air through which it ascends. This is so because the surface air is warmer than the air aloft. This gives rise to very extensive areas of extremely low surface pressure in high latitudes.
As the ozone content of the air increases in winter, the jet streams so formed become more intense.
As the ozone content of the air varies from year to year, so too does surface pressure in high latitudes.
As surface pressure falls away in high latitudes it rises in the mid latitudes where anticyclones form.
How far does the air ascend in polar lows?

The pattern of ascent is still present, albeit more gently so, at 70 hPa (above) with 93% of the weight of the atmosphere below, an elevation of just 17 kilometres. A balancing descent occurs in the mid latitudes associated with anticyclones.

The air is still mobile at 10 hPa (30km) with 99% of the atmosphere below. Importantly, there is both ascent and descent.

See above. At 10 hPa in early spring in the southern hemisphere the air is very mobile in high latitudes. Gentle descent is apparent over the cold waters south of the equator in the eastern Pacific. This feeds ozone into anticyclones.

Above, at 70 hPa we have very strong ascent in the high latitudes and broad areas of gentle descent in the mid latitudes. The southern hemisphere is approaching its seasonal peak in ozone partial pressure that occurs in October. The winds at 70 hPa reflect where that peak occurs. We are looking at a donut shape sitting atop the Antarctic continent.

At 250 hPa the southern hemisphere is in a frenzy driven by differences in ozone partial pressure between air masses of different origin. Patterns of descent will drive the evolution of geopotential height, cloud cover and surface temperature in the manner described in chapter 3.
At 500 hPa there is a relaxation in the circulation.

At 700 hPa the winds are more benign. The pattern of descent over the south Eastern Pacific is typical.

The pattern of surface pressure is closely aligned with surface winds. Very high pressure in the south eastern Pacific is associated with very cold waters in this region promoting settlement. This area gains atmospheric mass very strongly when it is lost at 60-70° south very much influencing the strength of the trades and the westerlies across the Pacific and thereby the ocean currents that determine the relative extension of the ‘cold tongue’ across the equatorial Pacific that is the essence of the ENSO phenomenon.

The flow of the air over Antarctica at 70 hPa is very much related to the pattern of surface pressure forced by the ozone content of the air at lower altitudes. It is the ozone content of the air between 500 hPa and the 250 hPa that is deterministic so far as the circulation of the winds is concerned.
Notice the zone of high surface pressure over the Antarctic content that sets up a pattern of descent near the surface.
Mesospheric air descends in the core of this circulation. It is relatively deficient in ozone and has damaging levels of the ozone destroyer NOx . The British Antarctic base at Halley Bay lies to the East of the Antarctic Peninsula. When total column ozone was first measured there using Dobson’s spectrophotometer in 1956 Dobson was amazed at the relative deficit in ozone by comparison with the northern hemisphere. But the deficit disappeared in November, as it does today. As surface pressure has fallen in high southern latitudes due to the increase in the partial pressure of ozone in the donut shaped pattern of polar cyclone activity that surrounds Antarctica, as atmospheric pressure has increased in the mid latitudes of the southern hemisphere expanding the Hadley cell in response to falling pressure in high latitudes, the donut of low pressure has been forced south, the tongue of mesospheric air is narrowed but it penetrates more deeply. This is the chief, albeit unrealized, one hundred percent home grown, all natural, ozone hole dynamic.
CONCLUSION
So called ‘cold core’ polar cyclones are warm core aloft and they do not contradict the laws of physics. By virtue of the fact that they depend for their activity on the partial pressure of ozone in the air that fluctuates on all time scales we must look to the cause of these fluctuations if we wish to understand the climate at the surface of the globe. It is the exchange of atmospheric mass between high and other latitudes that determines surface wind, cloud cover , the energy flux into the oceans and surface temperature. This is at the root of weather and climate change. I will demonstrate in later chapters that what happens in Antarctica rules all.
The flux in surface pressure that is wrought by ozone is greatest in winter and this puts a date stamp on the surface temperature record. That identity will be revealed in due course.

2 thoughts on “5 The enigma of the ‘cold core’polar cyclone”