Dr Tony Phillips of NASA maintains that “Understanding the sun-climate connection requires a breadth of expertise in fields such as plasma physics, solar activity, atmospheric chemistry and fluid dynamics, energetic particle physics, and even terrestrial history. No single researcher has the full range of knowledge required to solve the problem” http://science.nasa.gov/science-news/science-at-nasa/2013/08jan_sunclimate/
In fact it requires the efforts of a generalist, a synthesiser, like a bird that gathers a diversity of material to make its nest, to put this story together.
THE COMPOSITION OF THE ATMOSPHERE
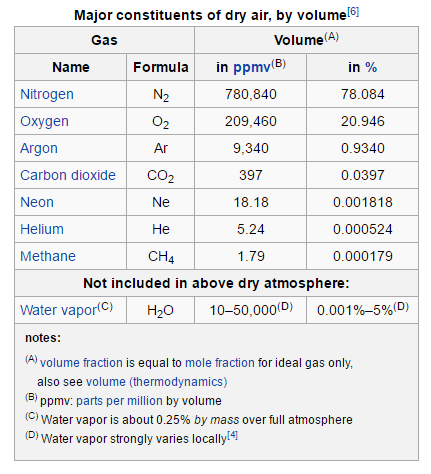
Nitrogen and Oxygen together represent 99% of the volume of the atmosphere. Neither ozone at up to 30 ppm nor CO2 at 400 part per million are in the list of the top eight atmospheric gases.From Wikipedia we have:
The wave lengths emitted by the Earth are centred about the 9-10 um where ozone absorbs. It also absorbs at 5um. Because ozone, like water vapour is not uniformly distributed it gives rise to differences in air temperature and density. We are familiar with the manner in which the release of latent heat energises tropical cyclones. Climate science is blind to the manner in which ozone energises the atmosphere despite the realisation more than 100 years ago that total column ozone maps surface pressure. Carbon dioxide is another potent absorber of long wave radiation from the Earth but it is almost uniformly distributed. As such it plays no part in generating winds. It is differences in air density in the horizontal domain that drives the winds. The strongest winds are to be found above the tropopause due to marked differences in the ozone content of the air in the horizontal domain between the 300 hPa and the 50 hPa pressure levels.
The movement of the air is influential in determining the equator to pole temperature gradient and cloud cover. High pressure cells are relatively cloud free environments. Anything that increases surface pressure in the mid latitudes expands the relatively cloud free zone and warms the planet.
In all latitude bands surface temperature variation is greatest in the winter and the range of variation increases from the equator to the poles. This points to a polar dynamic as being responsible for natural climate variation. In the waxing and waning of polar cyclone strength according to the ozone content of the air we have a dynamic that can produce shifts in atmospheric mass. Shifts in mass are responsible for change in the planetary winds. This alone will change surface temperature.
It is vital therefore that we have a good understanding of how ozone comes to be, its distribution and the circumstances that will change its distribution and partial pressure.
PHOTOLYSIS
Ionization, photolysis, photo-dissociation and photo-decomposition and are all terms that are used to indicate a chemical reaction where electrons are dislodged from molecules by photons. How far this process extends into the lower atmosphere is a matter of interest.
A photon is a hypothetical unit of radiant energy. Photolysis is defined as the interaction of one or more photons with one target molecule. Any photon with sufficient energy can affect the bonds of a chemical compound. A photon’s energy relates to its wave length. Only the shorter wave lengths have the necessary energy to decompose the smallest atmospheric molecules.
SUSCEPTIBILITY TO PHOTOLYSIS
Because larger atomic weight molecules are more susceptible to photolysis than smaller atomic weight molecules only the smaller atomic weight entities can maintain their integrity at the highest altitudes.
In order of increasing atomic weight we have: Hydrogen = 2.016, Helium = 4.002602, Methane = 16.044, Steam = 18.02, Nitrogen = 28.0134, Nitric Oxide = 30.006, Oxygen = 31.9988, Ozone= 47.998
Since short wave radiation is progressively ‘used up’ in its passage though the atmosphere it might be expected that the ozone content of the air would increase as the rays that disassociate ozone were used up. The ozone content of the air would then increase all the way to the surface of the planet. Part 2 will explain why that is not the case. This chapter explains where ozone is to be found above the tropopause and why that is so. An understanding of this question is vital if we want to comprehend the movement of the air and the origins of natural climate change. More than 100 years ago it was observed that ozone maps surface pressure. Surface pressure variation is the essence of weather on all time scales.
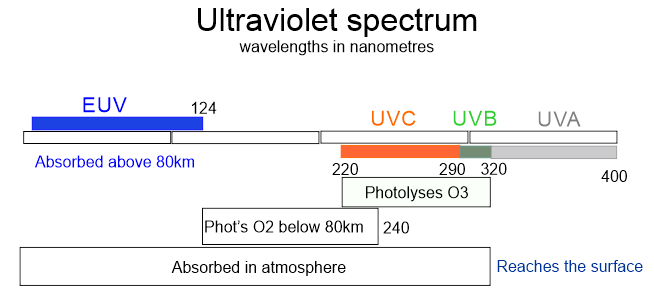
The ultraviolet spectrum includes wavelengths shorter than 400nm. These wave lengths can account for 8% of the energy that comes from the sun but only a fraction of that under quiet sun conditions. The power in the EUV spectrum varies tenfold over the course of a solar cycle.
It is only the very short wave radiation in the EUV spectrum, x-rays and gamma rays that is capable of disassociating nitrogen. EUV is wholly absorbed in photolyzing oxygen and nitrogen above 80km in elevation in the ionosphere.
A wave length shorter than 240 nm is required to disassociate oxygen.
Ozone is susceptible to ultraviolet waves shorter than 320 nm. This includes UV-C (220-290 nm) and UV-B (290-320 nm).
Wave lengths longer than 320 nm have relatively free passage through the atmosphere. There is insufficient ozone in the southern hemisphere to screen out wave lengths in the UVB and perhaps part of the UVC. This has important consequences for plants and animals because this radiation penetrates deeply into the cells of an organism. Human skin containing low levels of melatonin is particularly susceptible. If ones sees blood vessels below the skin, so too does UVB.
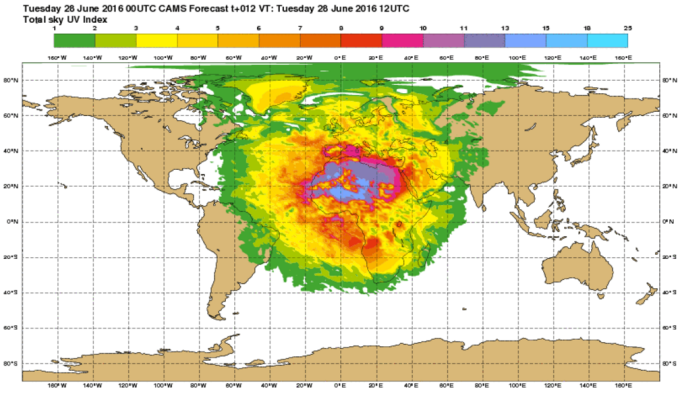
It is change in atmospheric ozone that determines the degree of penetration of short wave radiation to the surface. Cold air from high latitudes comes with more ozone aloft producing low surface pressure. When surface pressure is lower the risk of UV exposure is also lower because of the superior ozone content of the upper air. Climate change has involved a southward movement of the high pressure belts in the southern hemisphere, reduced rainfall in southern Australia and also an increase in the UV risk factor.
The UV risk factor at the surface is time of day and time of year specific and it also depends upon cloud cover. The processes of atmospheric ionisation are similarly focused on just part of the atmosphere and the intensity of the process varies according to the time of the year and the stage of the solar cycle. The diagram below is instructive in this respect.
WHERE DOES THE IONISATION OF THE ATMOSPHERE OCCUR?
Australian researchers contribute to the global effort in the field of radio astronomy. The diagram reproduced below appeared in a presentation delivered in 2012 to a CAASTRO EoR Radio Astronomy workshop in Sydney by Dr Mike Terkildsen of IPS Radio and Space Services as reported here: http://www.spaceacademy.net.au/env/spwx/raiono.htm
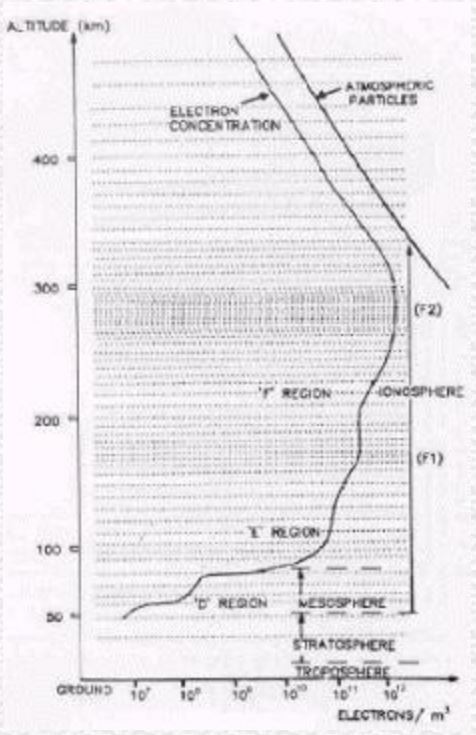
Note that the fall off in the electron concentration above 300km in elevation relates to the decline in the number of particles that are candidates for ionization.
I quote: The ionosphere is what we term a weak plasma, as only one percent of the neutral atoms in the upper atmosphere are ionised. Traces of ionisation exist from about 80 km to 1000 km in altitude, with the peak ionisation occurring around an altitude of 300 km. The maximum ionisation can vary from about 1010 to 1013 electrons per cubic metre.
Ionospheric ionisation is controlled by extreme ultraviolet and soft x-ray flux emitted by the Sun. The lower regions of the ionosphere show almost exclusive solar control in that the ionisation at any time is proportional to some function of the solar zenith angle at each point as is seen below.
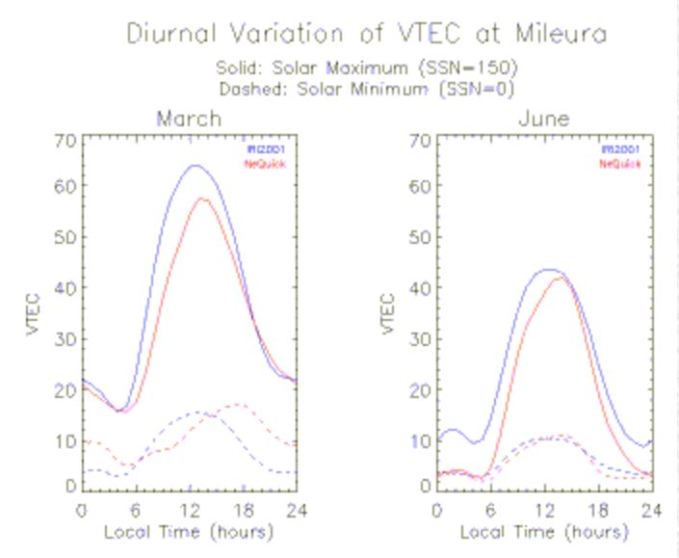
Mileura is a radio observatory located in the Murchison district in Western Australia at 26° south latitude where radio wave interference is light due to remoteness from centres of population. We see the dependence of VTEC (Vertical Total Electron Count) at the Mileura observatory on time of day and the state of the solar cycle. Notice the dramatic difference between daylight and dark. The difference between the maximum in the solar cycle and the minimum is as much as between day and night. There is a very strong impact of the angle of the sun that is reflected in the VTEC for the month of June.
This diagram helps us to understand that latitude impacts the degree of ionization of the atmosphere. Accordingly, at latitudes greater than 23° north or south the winter season will see a marked reduction in the vertical total electron count. We know that ozone partial pressure peaks in the high latitudes of the winter hemisphere. The availability of building blocks in terms of free atoms of oxygen to form ozone is least in winter. Ozone is not built in high latitudes via the dissociation of the oxygen molecule by UV light. It is transported there. The increase in the ozone content of the air in high latitudes in winter is not due to transport phenomena because the act of transport can not increase the concentration of any particular constituent. That increase in winter is due to low disassociation rates.
The altitudes where ionization maxima occur are referred to as the D, E and F regions. The D region sees strong ionization only in daylight hours.
COSMIC RAYS AND A POSSIBLE IMPACT ON CLIMATE AT SOLAR MINIMUM
Some researchers refer to a lower C layer created by galactic cosmic radiation, a force that is independently capable of ionising the atmosphere that is particularly active over the poles. This activity can be monitored as a muon count. Precipitating muons penetrate to the surface and to deep underground, their incidence increasing with the temperature of the polar atmosphere. It follows that the muon count creates a proxy record of the incidence of stratospheric warmings. Stratospheric warmings and in general the variability of the temperature of the stratosphere over the pole occur in winter where they build on a low base temperature established due to the descent of cold mesospheric air. The stratosphere warms from this low base as the tongue of very cold mesospheric air either withdraws or is displaced by ozone rich warmer air that circulates on the margins of the tongue outside what is referred to as ‘the polar vortex’. The vortex, is a rapidly circulating cone of air energised by the conjunction of cold dense air inside the vortex and ozone rich low density air outside the vortex.
Paradoxically, in the world of climate science the term ‘strong vortex’ relates to the situation where the flow of mesospheric air towards the surface is weak due to low surface pressure in the polar regions. In the Arctic, weak atmospheric pressure ensures that cold air is retained at high latitudes. This is the positive phase of the ‘Arctic Oscillation’.
In climate science a ‘weak vortex’ refers to the situation where the AO index is negative, polar surface atmospheric pressure is high, the downdraught of mesospheric air is strong and cold air migrates into the mid latitudes. In this situation the jet stream that marks the edge of the polar vortex that in turn relates to the position of a chain of intense polar cyclones, wanders equator-wards taking with it very cold air. Is it any wonder that there is confusion about matters polar?
The notion of strong and weak vortex as described above is at odds with the circulation of the air in the stratosphere. In the stratosphere a faster zonal wind corresponds with deeper penetration of mesospheric air and weaker polar cyclone activity due to the erosion of ozone. The result is a return of atmospheric mass to the pole from the mid latitudes and an accelerated flow of of cold polar air to the mid latitudes. So a strong stratospheric flow is associated with coldness, not warmness. At the root of this problem is the notion that the vortex is some sort of impenetrable wall across which little mixing can occur. The reverse is actually the case because between the surface and 50 hPa polar cyclones violently mix very different atmospheric constituents from both sides of the ‘vortex’. The problem is a lack of appreciation of the motive force behind this circulation and a complete misinterpretation of its geometry. Behind that problem is the notion that the circulation of the atmosphere is just problem in fluid dynamics where the energy to drive the system is assumed to be heating at the equator. In all other respects it is assumed that the system is closed to external influences. Primitive thought patterns. Well, in fact that is not the case at all. All change begins in the Antarctic stratosphere. It is no accident that the entire southern hemisphere is something of an ‘ozone hole’.
Recent research (abstract below) suggests that ionisation due to cosmic rays in polar latitudes may be a pathway for the generation of ozone down to jet stream altitudes. If this is the case stratospheric warmings will be associated with the generation of ozone and the intensification of polar cyclone activity that lowers surface pressure across the entire polar cap impeding the flow of mesospheric air into the ozonosphere and, via the impact of enhanced ozone in columns of descending air in the mid latitudes, evaporating cloud and warming the surface of the planet. However, the solar wind conditions the ionosphere in such a way as to inhibit the flux of cosmic rays that reach the upper atmosphere. According to this construct the response to cosmic rays will tend to be greater at the low point of the solar cycle as the fluctuations in the solar wind are diminished at this time. There is in fact evidence in the incidence of the El Nino Southern Oscillation phenomenon that the climate system is particularly variable in terms of the distribution of atmospheric mass during solar minimums and it could be the cosmic ray mechanism that is responsible.
At this point it is important to note that the cosmic ray effect is dependent upon warming of the stratosphere that is in turn dependent on surface pressure over the polar cap. It is high surface pressure in winter that drives the zonal wind in the upper stratosphere bringing that tongue of cold mesospheric air into the polar stratosphere. A change in surface pressure results in an immediate change in the temperature of the air over the polar cap conditioning the process of ionisation by cosmic rays.
THE ENERGY INVOLVED IN IONIZATION PROCESSES
The wave lengths that are capable of ionising atmospheric gases represent a tiny part of the electromagnetic spectrum emitted by the sun. The EUV itself contributes an insignificant amount to TSI, only a few mW m−2 , as compared to 1360 W m−2 , or a few parts in a million. Inevitably these very short wave lengths are exhausted in the process and largely so above 80km in elevation. But these wave lengths vary tenfold in terms of their power over the solar cycle. It follows that the state of inflation of the ionised region is a direct function of solar activity within the eleven year cycle and over the longer 100 and 200 year intervals between individual solar cycles of very low strength of the sort that the Earth is currently experiencing.
During the satellite age we have seen a marked reduction in the incidence of EUV radiation in line with reduced sunspot activity. In consequence the elevation that is required to reduce atmospheric drag on satellites is reduced and satellite life has been extended well beyond design expectations. This is a direct consequence of a reduction in the output of EUV by the sun. Over this period the concentration of ozone in the stratosphere shows no such variation. It is plain that the ozone content of the stratosphere is independent of the output of short wave radiation from the sun that is responsible for the inflation of the ionosphere.
The diagram below is included to give a sense of scale. We see that the temperature of the upper atmosphere peaks at the 1 hPa level (50 km) with 99.9% of the atmosphere below. This is just below the level where the D region of the ionosphere manifests during daylight hours (60- 75km).
The temperature of the upper air from about 7km in elevation at the poles and 15km at the equator, is conditioned by the presence of ozone that absorbs in the infrared spectrum emitted by the Earth and its atmosphere. The decline in the temperature of the air in the mesosphere that lies between 45 and 80 kilometres in altitude relates to the declining partial pressure of ozone. The increase in the temperature of the air beyond the mesosphere relates to energy gain in the process of ionisation. But remember that only one percent of the neutral atoms in the upper atmosphere are ionised. That is 1% of the 0.01% that is present above 1 hPa. It does not take a lot of atmosphere to exhaust the incident EUV wave lengths.

OZONE CREATION IN LOW LATITUDES
Given that the ionic population in the D region exists in the main above 50 km in elevation we can infer that ozone is created in the main in the mesosphere that represents the transient tail end of the ionosphere. Below the mesopause the population of ions is adequate to support chance encounters between atoms and molecules of oxygen to enable the synthesis of ozone, at least in daylight hours. Here the intensity of destructive radiation is so diminished (particularly at night and at low sun angles) as to allow the large ozone molecule a life. It is then diffused or carried to lower elevations in areas of descent. It follows that the ozone content of the atmosphere below the levels where ionisation is possible is a function of atmospheric dynamics, day length, chemical interactions and the seasonal existence of relatively ‘safe zones’ in high latitudes where the atmospheric path is long and the wave lengths in the UVB and UVC spectrum are so eroded that the atmosphere offers a safe haven for ozone.
The upshot is that the stratosphere in general represents a relatively ‘safe zone’ for ozone, and particularly so in the winter hemisphere. This interpretation is consistent with the observation that the ozone content of the atmosphere varies little across the solar cycle even though EUV varies tenfold. In trying to understand the Earth system one must always remember that the Earth is an orb that rotates about the sun taking 365.25 days and spins on an axis that is inclined 23.5° off a vertical that is at right angle off the plane of its orbit. At the top of the atmosphere irradiance varies by 6% across the year due to the elliptical nature of this orbit and is greatest in January when the Earth as a whole is coolest due to increased cloud cover. This is very different situation to a plane surface that is uniformly lit from vertically above.
Between 1 hPa and the upper limits of the mesosphere at about 80 km in elevation, the temperature of the air and its ozone content descends to a minimum. This minimum is called the mesopause. Beyond the mesopause, atmospheric temperature increases in line with the excitation of the atmospheric constituents by extreme ultraviolet radiation.
It should be borne in mind that the temperature of the atmosphere that contains ozone (between the mesopause and the surface of the planet) is in part a function of the energy absorbed by ozone in the infra-red and secondly due to the energy released by the disassociation of the ozone molecule as it is ionised. However there is in practice a more influential factor at work. The temperature of the air in the stratosphere is mostly a function of the origin of the air as it moves vertically and laterally within the stratosphere. On a spherical surface that is not uniformly lit the temperature of the air very much depends upon its origin.
The notion that the stratosphere is a relatively safe place for ozone is supported by the following observations:
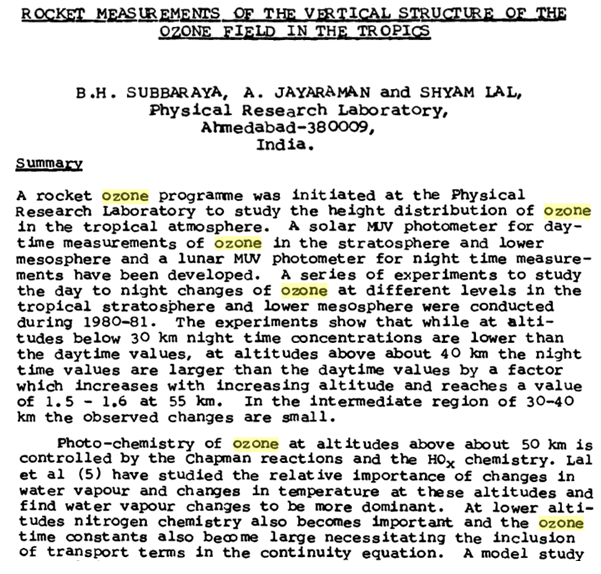
It appears that 40km in elevation over India is the point at which the atmospheric profile changes. Above 40km the night time partial pressure of ozone is greater than the day time as one would expect if the pressure of ionization during daylight hours actively depleted ozone faster than it forms up. Below 40km in elevation, daytime values are higher than night time values indicating a relatively safe environment so far as ionisation is concerned.
CONVECTION IN THE STRATOSPHERE
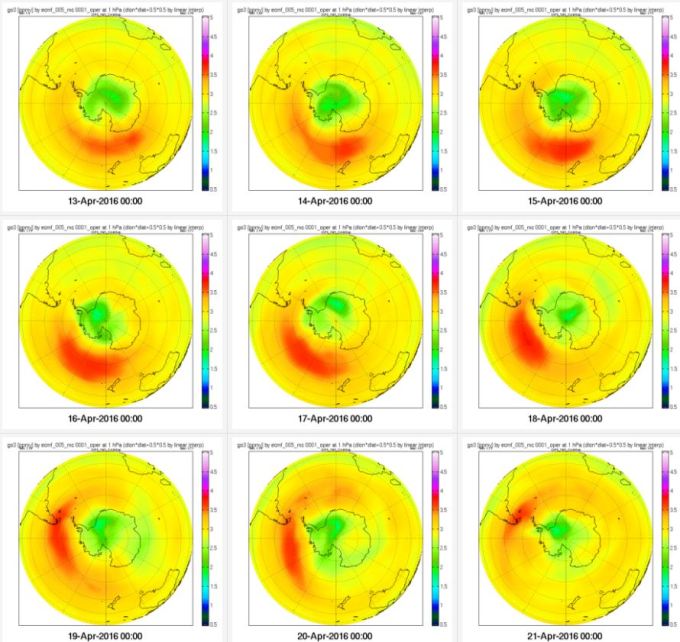
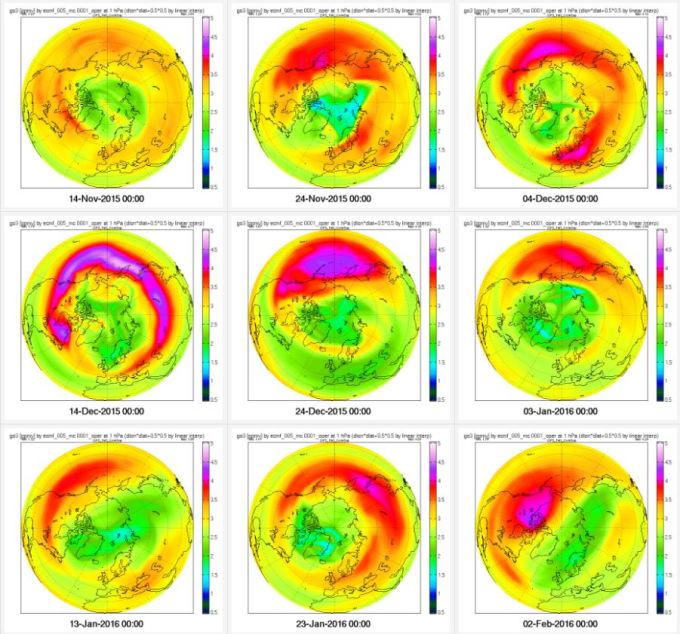
In the diagram below we see that at the 1 hPa pressure level there is a cyclical accumulation and dissipation of ozone over centres where surface pressure tends to be low in winter (the oceans). This convective phenomenon occurs in the lee of the continents and in particular, in 2016, over New Zealand in winter. This particular cycle comes and goes in the space of 9-11 days and is convective in origin. It is erroneously attributed to ‘Planetary waves’. In fact, the annular ring of high ozone values that surrounds the pole, strengthening in winter represents air of low density that is ascending to the top of the atmosphere, or at least to a level where 99.9% of the atmospheric mass is beneath.
In the northern hemisphere the Pacific Ocean tends to be the zone where low surface pressure promotes the accumulation and ascent of ozone rich air. The distribution of ozone at 1 hPa is seen below, across a similar cycle of convection in the northern hemisphere.
CONCLUSION
It is suggested that the existence and persistence of ozone in the stratosphere is in the main a response to the reduced pressure of ionisation below an elevation of about 40 kilometres over the equator. In the winter hemisphere ionisation via short wave radiation from the sun is not a factor of importance allowing ozone partial pressure to build. The influence of cosmic rays may be to build ozone levels at high latitudes and particularly so during stratospheric warmings. The distribution of ozone responds also to convective processes. The temperature of the air in the stratosphere will depend in the main on its response to radiation from the Earth itself rather than the process of ionisation. Air from the mesosphere is cooler regardless of its ozone content. It is well observed that air moving from low to high latitudes at the 100 hPa pressure level is cooler due to its lower ozone content. The stratosphere is warmer at the poles than at the equator due to enhanced ozone content even though the amount of infrared radiation that is available to energise ozone is much reduced. This tells us that the amount of radiation available to energise ozone is never limiting, even at night. The air at the tropical tropopause, markedly deficient in ozone, is at a similar temperature to the air in the mesosphere, about minus 85°C.
It is the exhaustion of ionising radiation above the mesopause that allows ozone partial pressure to build at lower elevations. The partial pressure of ozone can only build when the ozone molecule is free from disassociation via wave lengths that are longer than the EUV wave lengths responsible for the ionosphere. In low latitudes this may be the case at about forty kilometres in elevation and it will be higher in mid and high latitudes. The atmospheric path is long enough to filter out the wave lengths that can disassociate ozone when the sun is low in the sky. During the polar night the atmospheric path is …….. somewhere else.
Due to the minute partial pressure of ozone that rarely exceeds 30 ppm, and only in very protective environments near the poles, the surface of the planet is never completely free of radiation at the wave lengths that can disassociate ozone. It is the paucity of ozone in the southern hemisphere that is responsible for the pressure of damaging short wave radiation at the surface. The Andes Mountains experience particularly large amounts of energetic ultraviolet radiation due to their elevation.
The dilution of ozone via the descent of mesospheric air pre-conditions the entire southern hemisphere to an ozone deficit and is responsible for the weathered, leathery, ‘Australian skin’ and by contrast the extreme levels of melatonin in the skin of Australia’s very well adapted native peoples.
Part 2 describes the forces responsible for the erosion of ozone near the surface of the planet, the highly variable height of the tropopause and its lack of clear definition when observed on short time scales. It is seen that ozone partial pressure is greatest where ozone is free from erosive influences emanating from the surface of the planet.

Ok…so In summary, when the amount of ozone is depleted, more ultraviolet energy reaches Earth, cooling the lower stratosphere, warming the upper troposphere, and raising the Lapse rate height of the tropopause. But ozone reactions occur in short time frames and (dry atmospheric) gases have limited heat capacity to warm the Earth significantly. Primarily, its only the UV with the energy intensity that can penetrate water to provides this long term heat latency, thus its by warming the oceans we see the long term surface temperature change. Winds at surface created by warmer surfaces over ocean than land at night, the opposite at day when land surfcaes heats faster. … Ps. Am yet to think through the High/low pressure cells part in this chapter, but do like the ” no Cloud in high Cell” reference. Cheers, will re read this, absorb it. Lots to agree with and dots to connect in it. I look forward to next chapter.
LikeLike
Macha, lets say that the operative mechanism for warming or cooling is the absolute area occupied by relatively cloud free high pressure cells centred on about 30° south travelling west to east around the globe. Increase the surface pressure in this area and the cells get bigger. Reduce the surface pressure and the cells get smaller. Bigger expanse of cloud free sky causes warming and smaller expanse causes cooling.
What could cause the increase in surface pressure in the mid latitudes?
LikeLike
Hi Ealr, Have yiu seen this paper, by australian researchers? http://www.gizmag.com/plasma-tubes-ionosphere-cleo-loi/37843/
All the Best William
LikeLike
William, A scintillating bit of work. Thanks for bringing it to my attention. Helps us to maintain a sense of scale when we look at the structure of the atmosphere. That these plasma tubes establish where they do is instructive. 1000 km is not at all far. You can drive that distance in half a day. What would be very interesting is to try and focus at lower altitudes to see if one can discern the origins of the super-rotation of the atmosphere. It rotates in the same direction as the Earth from west to east but faster and more so in high latitudes. I suggest that the atmosphere is responding to electromagnetic forces. The lower ionosphere is a weak plasma down to 80 km in elevation (the mesopause) and a number of gases, even at lower altitudes (like ozone) will orient themselves and move in an electric field. The lower atmosphere in the polar regions is ionised by cosmic rays.
I note the lag phase in this comment. ‘before any such research could be made a reality, Loi first had to overcome the skepticism of senior colleagues who thought that her results from the observations may have been a little too enthusiastic and premature.’
The field of climate science and our understanding of the natural world could benefit enormously from investigation of how things move in an electromagnetic field. Why does length of day vary? Why does the zonal wind vary?
Loi, may the force be with you.
LikeLike
I assume you did mean latitude not altitude. Ie.typical Australian high pressure westerlies. If so I would suggest an increased surface pressure can be caused by conventional Hadley cell type convection, ex-equatorial and falling downward from higher altitude at Mid-latitudes. So here a denser air mass can exists above even a cool cell and it will cause an increase in pressure. The downward force of that dense air mass produces an increased pressure and pushes winds outwards, perhaps sucked into a polar low pressure vortex. Does it need to be more complex than That? But I think my response is too basic and you are trying to lead me in another direction here and, moreso, you already have an answer of your own. Ps. I am still on the ozone depletion band wagon, and picking up passengers.
LikeLike
Yes, I did mean latitude. The main way in which surface pressure can increase in the mid latitudes is via a transfer of atmospheric mass (more molecules) from some other latitude. To achieve that you need to generate low pressure somewhere else. A chain of polar cyclones can do that and there is always a big chain around the Antarctic continent as we see here: https://earth.nullschool.net/#current/wind/isobaric/10hPa/overlay=mean_sea_level_pressure/orthographic=-0.33,-90.08,367/loc=142.360,-61.687
There has been a 10 bar loss of atmospheric pressure over the Antarctic continent since 1948. That came with a warmer stratosphere over the pole and throughout the southern hemisphere that is due to greater ozone partial pressure which in turn heats the air, reduces its density and drives intensified polar cyclone activity. There is no other latitude that has gained atmospheric mass and surface pressure as much as 30° south.
LikeLike
Cheers erl, I think your first paragraph means we say the same thing to that point. Sure, pressures need to balance but equilibrium is not maintained so how long do you wait for it in a dynamic envrinment. . Interesting article popped up.. here..http://88.167.97.19/temp/The%20Mobile%20Polar%20High%20a%20new%20concept%20explaining%20present%20mechanisms%20of%20meridional%20air-mass%20and%20energy%20exchanges%20and%20global%20propagation%20of%20palaeoclimatic%20changes_Leroux-Global-and-Planetary-Change-1993.pdf
LikeLike
Mobile polar high is a northern hemisphere thing coming out of Siberia. In Antarctica the high pressure cell over the continent stays put. The mid latitude highs increase and decrease in strength according to the activity in the lows.
LikeLike
You can see the beginning of another wave in the stratosphere in the south.
LikeLike
Got it Ren. Here is the one in the last half of May as seen in the ozone content of the air at 1hPa as a result of convection from below feeding into a big low pressure system that brought fierce winds to New Zealand. https://i2.wp.com/reality348.files.wordpress.com/2016/06/planetary-wave-last-half-may-2016.png?ssl=1&w=450
Have you got any comments on this post? Any points of disagreement?
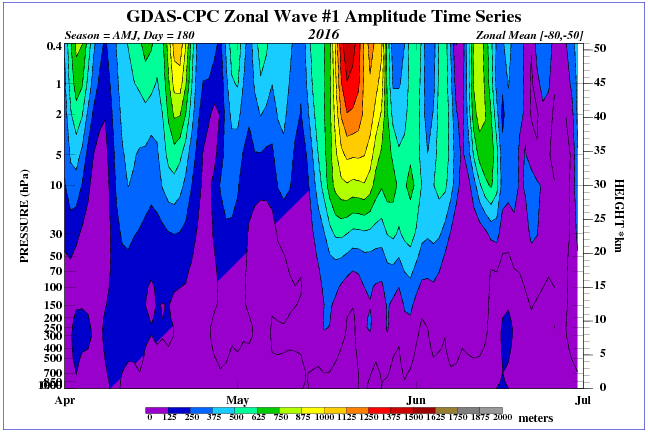
I see that WAVE 1 is calculated from the average geopotential height between 50° and 80° of latitude. The increase in geopotential height is greatest at and above 1 hPa where the ozone accumulation is very noticeable because its so localized, it can’t go much higher because there is only 1% of the atmosphere above that elevation. The other thing to note is that the ozone is not instantly photolyzed away as it accumulates at about 50 kilometres in elevation. So, one can conclude that the pressure of ionization from short wave radiation is only slight at 50-80° south in May. That is part of the reason for these strong upper atmosphere warmings in winter and not in summer.
The other thing to notice is by setting the measurement latitudes at 50-80° south they are missing out on the action at 30-50° south and that is considerable. It would be better to set the latitude for observation of GPH at 35-70° south and in that way you catch the lot.
Do the people who measure these things know that it is ozone that is heating the air at 1 hPa or do they think its short wave radiation from the sun. If its the latter they are not putting 2 and 2 together. Perhaps they are trying too hard and still getting 3 as the answer.
LikeLike
Look at the wave of GCR from 1 June.
http://cosmicrays.oulu.fi/webform/query.cgi?startday=14&startmonth=05&startyear=2016&starttime=00%3A00&endday=14&endmonth=06&endyear=2016&endtime=00%3A00&resolution=Automatic+choice&picture=on
Because the impulse comes from the upper layers of the atmosphere, there must be a delay (I think about 7 days).
LikeLike
You will notice that the previous wave caused the rise in temperature.

LikeLike
https://i0.wp.com/reality348.files.wordpress.com/2016/06/cosmic-rays.png?ssl=1&w=450
Perhaps two hits and two misses. But I would not expect cosmic rays in the northern hemisphere to be related to warming in the southern hemisphere.
LikeLike
Anomalies pressure over the polar circle.
LikeLike
Thanks for those links Ren. Could be useful.
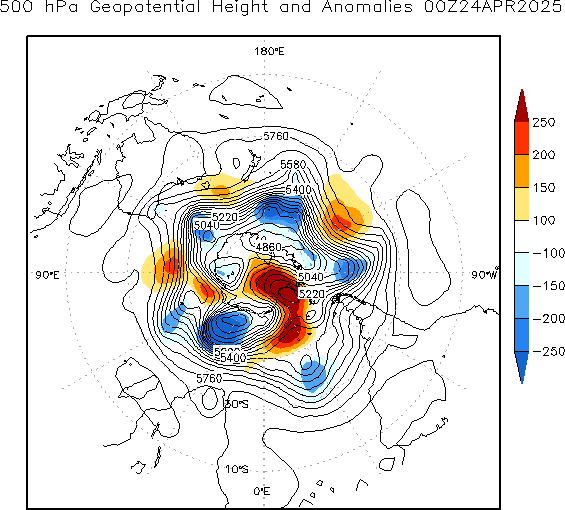
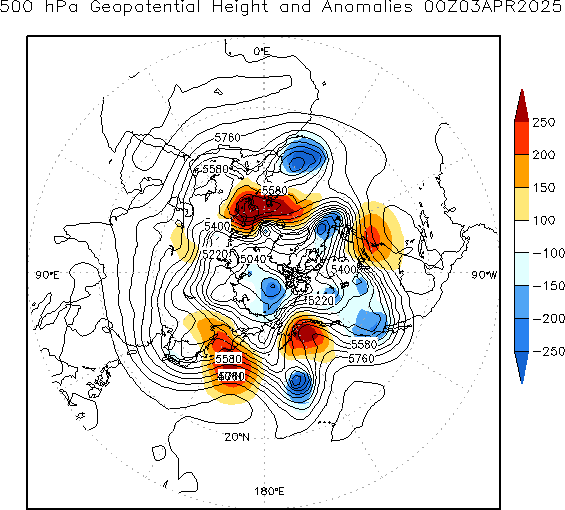
I read: Examples of the 500 hPa height and anomaly fields associated with mature blocking episodes over the northeastern Atlantic and the North Pacific. These two regions are preferred areas for atmospheric blocking during the northern hemisphere cold season.
Why? Because ozone proliferates within and intensifies the circulation within zones of low surface pressure where air ascends to the top of the atmosphere. These low pressure zones naturally locate over large bodies of relatively warm water in winter. The ocean is warm relative to the land. So, predicting the incidence of blocking requires observation of the upper atmosphere that shows patterns of evolution that are very different from one year to the next according to the ozone content of the air. Currently theory of upper atmospheric temperature evolution is all about ‘planetary waves’………absolute garbage.
Dobson observed that Total Column Ozone maps surface pressure. But that observation has been and continues to be ignored.
LikeLike
Reblogged this on Climate Collections.
LikeLike