According to Mark Twain, when it comes to numbers there are Lies, Damned Lies and Statistics.
Any form of manipulation to achieve simplification involves suppression of information.If one is to draw intelligent conclusions it is better to have all the original data. The less averaging the better.
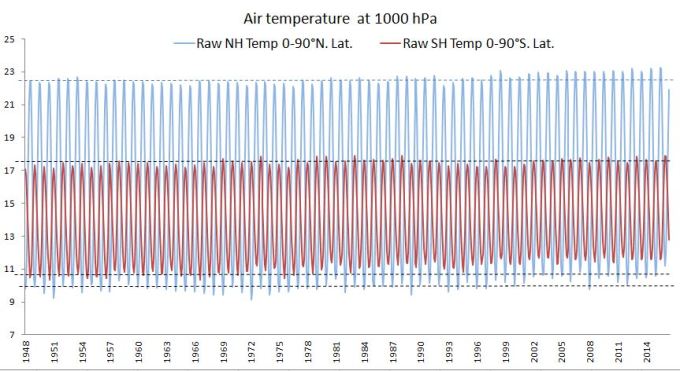
Even the act of aggregating for a whole hemisphere, as is done in figure 1, is questionable. A sphere exhibits very different characteristics across its surface and so does a half sphere. But, looked at in this way, its better to look at the two hemispheres seperately rather than together. The act of dividing the globe in half at the equator is a reasonable thing to do because the two are very different and we can learn in the process.
In figure 1 we have monthly data. The peak in the cycle is the warmest month and the trough is the coolest month.Between the two are all the other months.
The two hemispheres are about as different as two planets. Temperature in the southern hemisphere (red line) exhibits a smaller annual range. Winter is marginally warmer than in the northern hemisphere. Summer is a lot cooler. In the Southern Hemisphere temperature is moderated by the extensive oceans.
In the Northern Hemisphere temperature is driven up due to the extensive areas of land. This affects high more than low latitudes. The warming of the mid and high latitudes of the northern hemisphere in summer is due to atmospheric heating and loss of cloud cover. More solar radiation gets through the clouds to warm the surface. Paradoxically the Earth is furthest from the sun in July and accordingly solar radiation is 6% weaker by comparison with January. Straight away we see that atmospheric heating and cloud cover is the dominant influence on surface temperature while the degree of variation in surface very much depends on the ratio of sea to land. Who would have thought that? We have been told that it is the ‘greenhouse effect’ that makes surface temperatures what they are. In fact surface temperature depends on whether the Earths natural sunshade is in place or not and just how far a location is from the moderating influence of the sea. There is always less cloud over land than over the sea and particularly in those places where little rain falls.
In fact the ratio of land to water determines the extent of atmospheric warming and cloud cover on all time scales from daily through to annual. This is the strongest influence on surface temperature. Its due to the fact that the temperature of the air changes quickly and to a much greater extent than the amount of water vapour in the air that is required to form cloud. Water vapour content tends to be reduced by cold overnight temperatures giving us dew and cloud in the mornings and relatively clear sky at midday. The closer to the surface of the Earth, the more moisture can enter the atmosphere via evaporation from open water and plant transpiration. The more elevated the location, the colder is the air and , the lower is its moisture content. The higher the elevation, the less the air is affected by warming and cooling at the surface. The higher the elevation the more the temperature of the air is determined by its ozone content.
When the ozone content of air increases and it warms via the interception of long wave radiation from the Earth, the response is measured as increased geopotential height. Surface temperature rises in proportion to geopotential height. That is due to the cloud cover response. Surface pressure, geopotential height and surface temperature all rise and fall together.This is the natural climate change dynamic driven by change in cloud cover.
Enough of these ramblings. Back to figure 1. The dotted lines in figure 1 are strictly horizontal. They have no slope. These lines assist the eye to detect variations. There is a relatively small variability in temperature in the southern hemisphere in summer (upper limit of red series) over the last 69 years and no obvious trend. On this basis one can rule out carbon dioxide as a driver of surface temperature because the gas is well mixed. If there is a back radiation effect it needs to show its face here. Palpably it doesn’t. If the back radiation effect depends at all on enhancement by humid air and the presence of cloud we should see a continuous increase in the temperature of the air in the southern hemisphere from November through to March because this is the time of the year when cloud cover peaks. But, we see that there is no change in surface temperature in the warmest month of the year. However, we do see a gradual increase in coolest month temperature in the southern hemisphere from about 1970. This is the warming that needs to be explained.
Now, lets look at the northern hemisphere. Coolest month temperatures rise and fall over quite short time intervals. The 1970’s are the coolest decade in the northern hemisphere in terms of both the warmest summer month and the coolest winter month. Northern Hemisphere temperature increased after 1998 in both coolest and warmest month and this too needs to be explained.
A QUESTION OF TIMING
The raw data doesn’t inform us as to whether the climate cooled or warmed in spring or autumn. Does that matter? Come to think of it, if the global average rises due to an increase in temperature in the winter months is that really a problem. Would we not actually prefer warmer winters? Can we make rational decisions on the basis of a global average? Not really! Under a regime of dramatically increased summer temperatures with thousands dying of heat stroke and and dramatically reduced winter temperatures with thousands freezing to death, the average may be unchanged. We may think the planet is warming if we see a rising global average. But that could simply represent some warming in the coldest, abominably cold month so that month is slightly less abominably cold. Quoting the global average is the sort of thing that Mark Twain was complaining about.
Having dispensed with the CO2 furphy and the global average furphy we can now concentrate our on why the temperature changes as it does!
WHY HAS SURFACE TEMPERATURE CHANGED AS IT HAS
What stands out most in figure 1 is the warming that occurs in the southern hemisphere in winter (red line) starting in the 197o’s.
Given that the temperature of the air is a chilly 11°C in mid winter, this warming, and even more so, the warming of the northern hemisphere in winter, is unequivocally beneficial. This is a matter for congratulation rather than concern. We live in fortunate times. But it would be nice to know why this is happening because winter warming inflates the average for the globe as the whole and gives rise to a lot of hysterical nonsense that is swallowed by an uncritical media that take the point of view that the science of climate is a matter for ‘scientists’ and the average global temperature is Gods Word. These people have no idea what Mark Twain was talking about.
Politicians don’t read science. They read the daily papers. We get the blind leading the blind and a cabal of irresponsible scare mongers beating the drum and clashing the cymbals while snapping at the politicians heels demanding ‘clean energy’ and an end to ‘carbon pollution’. This is the modern ‘left’ in action. Its the Democratic Party in the US, the moneyed elite in the UK and an unholy alliance of Labour, The Greens and the soft underbelly of the Liberals in Australia. Even the Chinese, who in many ways are very practical people, seem to have fallen in love with this idea. If you muzzle the press, put the intellectuals in prison and rule with an iron fist you can do whatever you bloody well like. Can we pretend that what is happening in the West is somehow preferable? Can we point to a more rational and beneficial result from our ‘democratic process’? Cast not the first stone.
A PLAUSIBLE EXPLANATION
The warming of the northern hemisphere in both winter and summer starts in about 1998. Bear in mind that the warming in southern winter occurs at a time when global cloud cover plummets as the large land surfaces of the northern hemisphere heat the atmosphere. Is that warming due to an increasing ozone content of the air and a consequent decline in cloud cover?
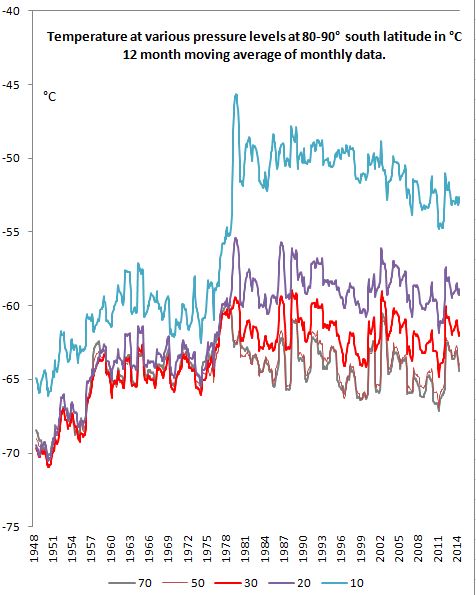
Figure 2 confirms a step up in temperature at the 10 hPa pressure level after 1976. This is predominantly a southern hemisphere phenomenon. The step up occurs in winter.The consequent much enhanced feed of ozone into the high pressure zones of descending air over the global oceans would reduce cloud cover. Under normal circumstances 90% of global cloud cover is to be found over the oceans and this is where high pressure cells form, especially in summer. When ozone rich air descends in a high pressure cell, the air warms (geopotential height increases) and this is always, without exception, associated with warming at the surface.So, the warming is due to loss of cloud cover.
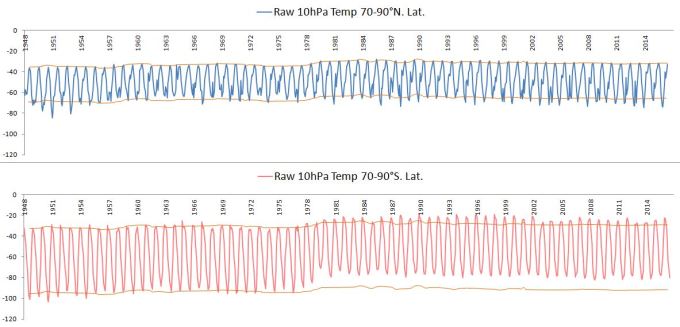
Now, I want you to sanction something quite unorthodox and shocking.
In figure 2 the hand drawn line that links the high points in the summer maximum in the northern hemisphere is copied and applied to the northern minimum and to both the minimum and the maximum in the southern hemisphere. This unsophisticated ‘sleight of hand’ is performed as a ‘seeing aid’ to discern the points of difference. I guess I am just a frustrated artist and the mathematical exactitude of Excel is humanised by this process.I was once told by a plant breeder that if you cannot see the difference in plant performance by eye that difference is not worth measuring. It’s somehow comforting to realise that we don’t always need mathematical manipulations in order to get to the nub of the question.
Some points to note:
- Winter minimums are more variable than summer maximums and particularly so in the northern hemisphere.
- Whole of period change at 10 hPa is greatest in the Antarctic. Those who make a close study of the matter have worked out that this is where natural climate change begins. Here is the documentation: Antarctica is the source of natural climate change.
- At the surface, the widest range in temperature between summer and winter is seen in the northern hemisphere but that is not the case at 10 hPa. It is the southern hemisphere that exhibits the big variations.
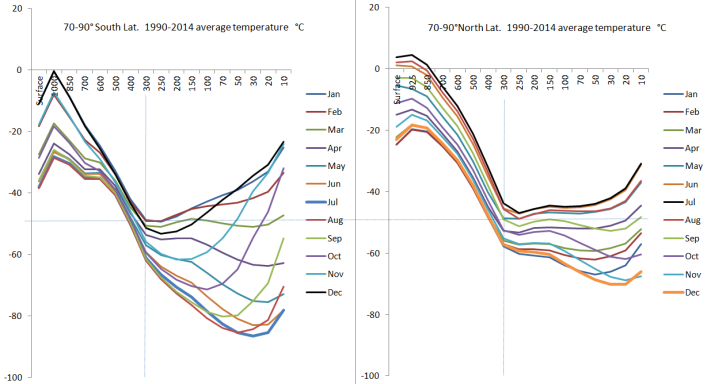
Now in the last point we have an anachronism and a clue. See Figure 3.
The wide range in temperature at 10 hPa in the southern hemisphere is due to the variable intake of mesospheric air over Antarctica in winter. This intake of cold air cools the upper stratosphere. It does not affect the temperature of the air at elevations below 300 hPa. The deepest cooling occurs at the 30 hPa pressure level in July. Why is it so?
In winter surface pressure in the Antarctic region reaches a resounding planetary high. Nowhere else, anywhere on the globe, in any season of the year does surface pressure approach that achieved over Antarctica in winter. Air from the mesosphere has a low ozone content and it dilutes the ozone content of the atmosphere generally.The enhanced flow of mesospheric air into the southern hemisphere causes a generalised deficit in the ozone content of the air in the entire southern hemisphere. Alternatively, when the flow is choked off (surface pressure rises) there is an increase in the temperature of the air and its ozone content.
It is easy to see how the ozone content of the air can change over time via an alteration in the mesospheric flow.
TEMPERATURE VARIABILITY
See figure 4 below. The short term variability that is seen in Arctic is much enhanced after February. It is initiated by a fall in polar surface pressure signalled by a rise in the Arctic Oscillation Index (the two are inversely related). This increase in 10 hPa temperature is likely reinforced in amplitude and duration by an increase in ozone partial pressure due to enhanced penetration of ionising cosmic rays as the stratosphere warms. The build up in the temperature over the polar cap is avalanche like in its suddenness. It represents the displacement of cold mesospheric air. The heating effect, observed to last for weeks at a time, requires amplification to persist in this way. Otherwise it would be gone in ten days. Without amplification the descent of mesospheric air should re-establish in short order . Patently it does not.
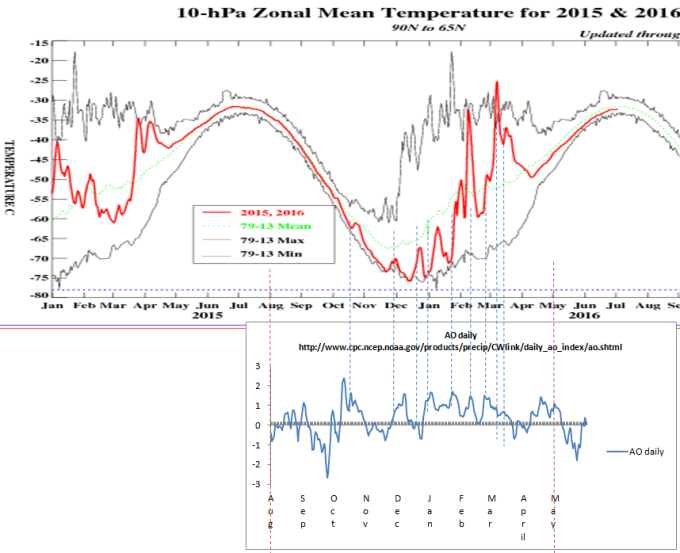
Figure 4. Mean temperature at 10 hPa compared with the Arctic Oscillation Index.
In Fig. 2 we observe little difference between the hemispheres in the evolution of 10 hPa temperature in summer. There is a slight step up in 1976. And, the step up in summer is greater in the south than the north.The change in the ozone content of the atmosphere is global, affecting the entire year and it is related to a fundamental change in the atmospheric circumstances over Antarctica, most pronounced in the winter season.
The ozone content of the air is rapidly propagated across the globe as we will see in figures 6 and 7 below. This testifies to the strength of horizontal winds in the stratosphere and most particularly in the area of overlap where stratosphere and troposphere occupy common ground.
So, the standout anomaly in figure 2 is the step change in 10 hPa temperature in southern winter after 1976. This step change in 10 hPa temperature is reflected in surface pressure data in figure 5 below.
In fact this step change in 1976 is reflected surface temperature data at every latitude across the entire globe as documented here.
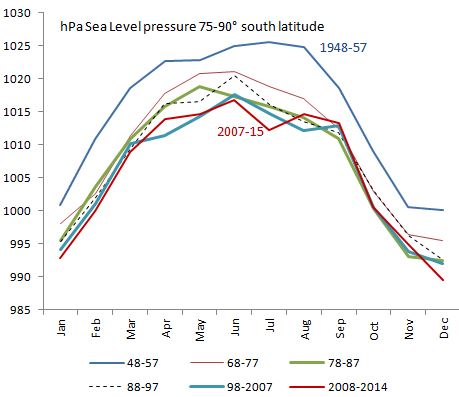
THE ACTIVE INGREDIENT:OZONE
As Gordon Dobson discovered in the 1920’s surface pressure is a reflection of the ozone content of the air and vice versa. The fall in surface pressure at 75-90° south latitude documented in figure 5 is a direct consequence of the increase of the ozone content of the air. It is the ozone content of the air that affects its density, the weight of the entire column and hence surface pressure.
Wind strength in the atmosphere is intimately connected with the ozone content of the air. The air is relatively still near the surface of the planet and also at the highest elevations. Wind velocity is most enhanced in the overlap between the stratosphere and the troposphere between 300 hPa and 50 hPa where abrupt change in the height of the tropopause is associated with jet streams.
The 10 hPa level is virtually the top of the atmosphere because 99% of atmospheric mass is below that pressure level. The rapidly ascending circulation at the pole elevates ozone producing the greatest temperature response at the highest elevations as is evident in Fig 6. The strong temperature response at 10 hPa is due to convection of ozone rich air that increases ozone partial pressure at the highest elevations. That ozone mixes across the profile and affects the ozone content of the air in descending circulations in mid and low latitudes.
The pressure gradient (density differential) across the vortex in the upper troposphere/lower stratosphere where polar cyclones are initiated determines the strength of convection. The density differential is increased seasonally as the ozone hole is established below 50 hPa when NOx rich air from the upper troposphere is drawn into the circulation over the polar cap during the final warming of the stratosphere.
The incidence of very much higher temperature at the 10 hPa pressure level after 1978 represents a step change in the fundamental parameters of the climate system. There is not one climate system here but many, as many as there are days in the year. Changing the ozone content of the air in high latitudes alters surface pressure differentials and therefore it changes the planetary winds.
A QUESTION OF TIMING
In figure 7 below we chart the evolution of 10 hPa temperature in selected months from the mid latitudes to the southern pole.
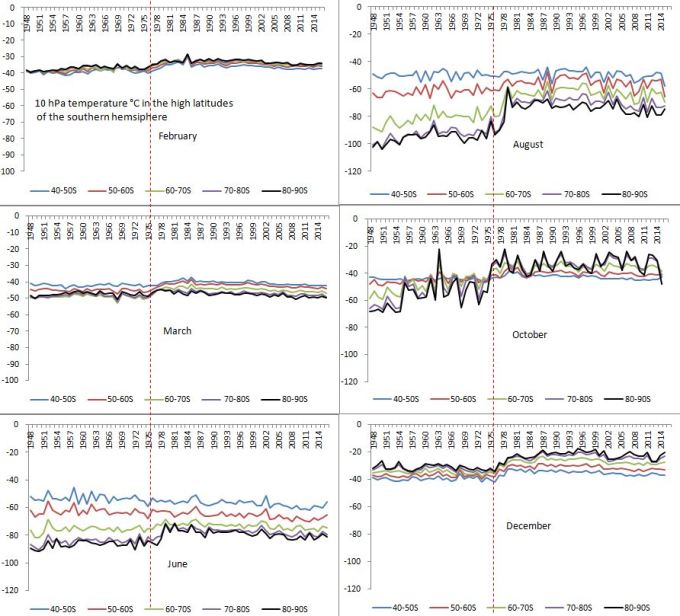
10 hPa temperature over the pole is greater at 80-90° latitude than at lower latitudes in summer. This is when mesospheric air is excluded and ozone rich air gently ascends to the top of the atmosphere. This phenomenon occurs over Antarctica between October and February.
10 hPa temperature over the southern pole is inferior to that at lower latitudes when mesospheric air is drawn into the circulation between March and October.
After 1978 we see a change in the temperature profile in all months. This is particularly so from June through to November. The transition month for the final warming prior to 1978 was November. After 1978 the transition occurs in October. Taken all-together this data indicates a fundamental change in atmospheric dynamics that inevitably produces an increase in surface pressure, geopotential height and surface temperature in mid and low latitudes.
This is the source of the warming in southern winter. It has nothing to do with the works of man.
The change in the temperature of the air at the 10 hPa pressure surface in the Arctic is a product of the combined influence of atmospheric dynamics at both poles. The Arctic is independently influential. Its calling card is extreme temperature variability in January and February. This can be seen in Figure 1 in the surface temperature in the coolest months.
Climate change is a matter of observation and common sense. There is not much of it about. When it comes to numbers there are Lies, Damned Lies and Statistics. Undoubtedly the leading offender is the global average of surface temperature as disseminated by GISS, The NOAA and the Hadley Centre, all dedicated to the dissemination of information in support of the nefarious activities of Global Green and the UNIPCC.

Well I say bugger everyone else Erl. I am still here and reading with great interest. Am miffed no other comments. I guess it means you have it all totally sussed and no need for further debate. keep it up. Macha
LikeLike
I really have no idea Macha. Perhaps its totally obscure. Perhaps I need to keep each post to a max of 800 words. Perhaps its not a topic of any real interest. Perhaps its like religion and not discussed in polite society. Who knows? Two or three posts to go and I have a building project in mind. Too much time at a desk is not good.
LikeLike
Your posts are great.
I have been looking at global warming-related sites for some time and have only just found yours via a link in comments in another site.
Maybe if you commented with links in other popular global warming-related sites such as Watts Up With That and JoNova you might get some interest. Yes, maybe the posts could be divided to be a little more bite-size. The double column format (at least that is what I see) is confusing. A snappy title is always useful. A theme picture for the site header might be useful. Just a little marketing (as above) might make a big difference.
It is a topic of interest!
LikeLike
Oh, and try allowing comments to show without moderation, unless they bear certain hallmarks which can require they be automatically withheld for approval.
LikeLike
Hi Mark and Macha,
Thanks for the feedback. The WordPress approval process works this way. Once approved first up, successive comments don’t go through an approval process.
From John Carlson a marketing consultant:
“I often discuss the absurdity of religion with a Catholic friend. He consistently agrees that while there is no evidence of a God, and the evidence against the existence of an all knowing, all loving, all-powerful God abounds – he still believes. He believes in something that he intellectually recognises to be absurd. No amount of evidence will change his belief.”
Carlson’s advice is: “Never criticize what someone believes – it is involuntary. Never set about trying to change beliefs, unless you have a massive budget. ”
So, who reads this stuff? Is it the case that one is always, almost without exception, “Preaching to the Converted”.
Come to think of it in my days as a youthful church goer I can’t remember a single instance of someone rising from their pew to ask a question either at the start of, during or at the end of a sermon! I wonder if its the same these days?
LikeLike
‘Preaching to the converted’: I can only comment on my own experience and reason to read blogs like yours. I bring a skeptical view to all knowledge, knowing that today’s truth has a good chance of being falsified or added to in a way that radically alters it. I like to read AGW blogs because they provide different perspectives on the issue from those found in the broader media. I like to read what other people, who tend to be enthusiasts for their topic, have to say. I tend towards thinking AGW fanciful, and welcome information that exposes some of the myths. At the same time if there is compelling evidence for the A part of AGW then I will accept it.
From what I see, for the authors, blogs are a way of rising from the church pew. Those who read the blogs and comment often have quite interesting discussions which develop from posts. Maybe 5% to 10% of comments form a part of a useful discussion. That is not bad. When I see a glaring problem with the logic I will post a comment indicating my confusion.
In short, blogs like yours tend to be the voice from the pew, and comments then dissect various parts of the arguments.
I am as easily swayed by propaganda as anyone else and I find it incredibly useful to have various points of view, various arguments, put before me. I have been in situations where I have had to listen first to a set of argument for a proposition and then a set of arguments against the proposition. At the end of the first (pro) set I would sit and wonder how anyone could possibly believe anything other than the pro argument. Then I would listen to the anti argument and pinch myself as to how I could possibly have fallen for the pro argument so completely. This was a regular occurrence and it ended up being a kind of game. I NEED various points of view in order to develop my own ideas in a reasonably nuanced fashion.
I think most people are the same, even if they exhibit entrenched views from time to time. Blogs like yours are useful in sustaining the process of questioning and debate.
—-
I am going to test the WordPress moderation feature on another of your posts to see if the permission for successive comments is post specific or blog wide. I am considering starting a blog (on an entirely different topic) and want to ensure commenters are not too restricted by WordPress.
LikeLike
Test worked fine, no moderation required for a comment on a different post. I noticed, in attempting to get to a different post, that you don’t have a list of posts – this can be automatically generated by WordPress and can appear in a margin.
LikeLike
Oh, yes you do have a list, but in the advertising world it is in the most overlooked part of a page, bottom LHS, and I just fell for it!!!
LikeLike
Mark, You are a very articulate person. You can write well and explain a point of view with clarity. The blog will be worth reading. Inspirational blogs: I enjoy reading Pointman at https://thepointman.wordpress.com/ d also https://chiefio.wordpress.com/
LikeLike
Hi Erl,
Don’t get discouraged. This all takes time. Academics are
more willing to follow bad theory that promotes a career
than to follow good theory that kills their future.
There was a great line in the movie ‘High road to China’.
” The ox is slow but the earth is patient”
LikeLike
In time, the exposition will be complete enough for us to consider details of mechanisms, mass balances, energetics, radiation physics etc..I look forward to ‘having an oeuvre to pick at’.
LikeLike
Very touching guys. Thanks for the encouragement. I like that line: The ox is slow but the earth is patient. But if spend too much more time looking at this screen I will go cross eyed. Perhaps I will slow the pace, take a breather, get some outside perspectives.
LikeLike
From the Northern Hemisphere: . Hailstorms this year affected not only regions prone to them, such as Burgundy and the Loire Valley, but also the Charentes region, Beaujolais and Languedoc-Roussillon. Only a fortnight ago, an extremely severe hailstorm in the Pic Saint Loup area north of Montpellier stripped the vines of their leaves and fruit, resulting in an estimated 60% crop loss and fears for next year’s harvest. And this is occurring in late summer/autumn prior to the usual harvest date.
Here is South West WA we have had a very cold winter with strong winds. So, severe chill rates. Vine growth in spring determines the crop potential. For a number of years we have had skinny springs. Not enough consistent warmth to enable the vines to establish a decent canopy of leaves prior to November.
This winter winds from the Antarctic have been unusually strong. This graph tells a story. https://reality348.files.wordpress.com/2016/09/recent-slp-40-50s1.jpg
It shows the relationship between surface pressure in high southern latitudes and latitude 40-50° south. It appears that the strong decline in Antarctic surface pressure over solar cycle 24 is shifting the transition point so that a wider extent of southern latitudes has been affected by the reduction in atmospheric mass as polar cyclone activity intensifies in the Antarctic Circumpolar trough. This is particularly apparent in the last 16 months. So, it is affecting more of the mid latitudes.
Need to check this against the sea surface temperature data.
Need to have a close look at the Arctic to see how it is being affected by these developments in Antarctica.
LikeLike
I just discovered your site. Very interesting. I need to read more, but I will try to spread the word. As Arnold said “I’ll be back!”
LikeLike