THE DISTRIBUTION OF CLOUD
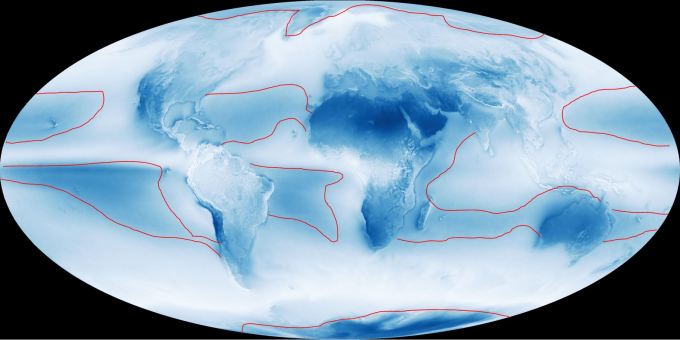
The map below has been edited by the author, adding red lines drawn freehand, to outline the darker areas over the oceans where cloud is, on average, less dense. The land tends to be relatively cloud free by comparison with the sea and shows up in tones of blue.In the mid latitudes there is a band of relatively cloud free air over the oceans, a ‘clear sky window’ if you will.
I am indebted to NASA for the photo above and the description of global cloud cover below. The original can be located at http://earthobservatory.nasa.gov/IOTD/view.php?id=85843&src=eoa-iotd
Over to NASA.
Decades of satellite observations and astronaut photographs show that clouds dominate space-based views of Earth. One study based on nearly a decade of satellite data estimated that about 67 percent of Earth’s surface is typically covered by clouds. This is especially the case over the oceans, where other research shows less than 10 percent of the sky is completely clear of clouds at any one time. Over land, 30 percent of skies are completely cloud free.
Earth’s cloudy nature is unmistakable in this global cloud fraction map, based on data collected by the Moderate Resolution Imaging Spectroradiometer (MODIS) on the Aqua satellite. While MODIS collects enough data to make a new global map of cloudiness every day, this version of the map shows an average of all of the satellite’s cloud observations between July 2002 and April 2015. Colors range from dark blue (no clouds) to light blue (some clouds) to white (frequent clouds).
There are three broad bands where Earth’s skies are most likely to be cloudy: a narrow strip near the equator and two wider strips in the mid-latitudes. The band near the equator is a function of the large scale circulation patterns—or Hadley cells—present in the tropics. Hadley cells are defined by cool air sinking near the 30 degree latitude line north and south of the equator and warm air rising near the equator where winds from separate Hadley cells converge. As warm, moist air converges at lower altitudes near the equator, it rises and cools and therefore can hold less moisture. This causes water vapor to condense into cloud particles and produces a dependable band of thunderstorms in an area known as the Inter Tropical Convergence Zone (ITCZ).
Clouds also tend to form in abundance in the middle latitudes 60 degrees north and south of the equator. This is where the edges of polar and mid-latitude (or Ferrel) circulation cells collide and push air upward, fueling the formation of the large-scale frontal systems that dominate weather patterns in the mid-latitudes. While clouds tend to form where air rises as part of atmospheric circulation patterns, descending air inhibits cloud formation. Since air descends between about 15 and 30 degrees north and south of the equator, clouds are rare and deserts are common at this latitude.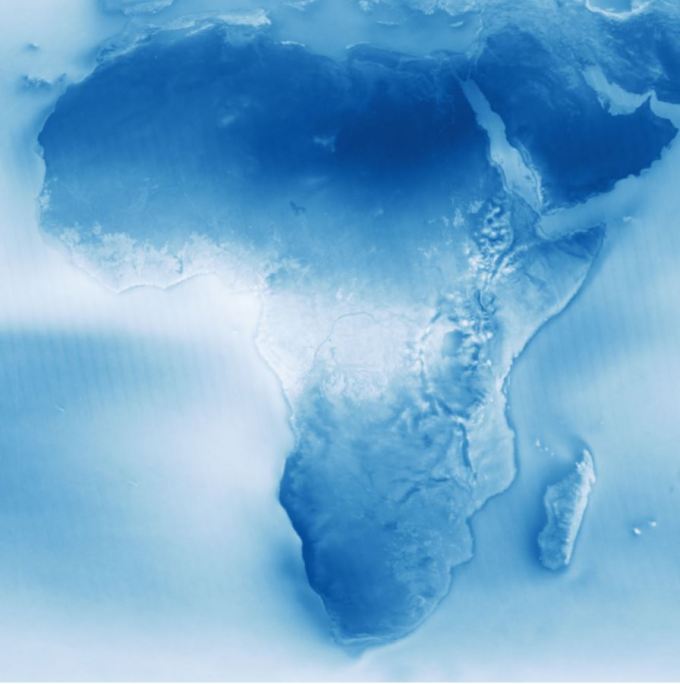
Ocean currents govern the second pattern visible in the cloudiness map: the tendency for clouds to form off the west coasts of continents. This pattern is particularly clear off of South America, Africa, and North America. It occurs because the surface water of oceans gets pushed west away from the western edge of continents because of the direction Earth spins on its axis.
In a process called upwelling, cooler water from deep in the ocean rises to replace the surface water. Upwelling creates a layer of cool water at the surface, which chills the air immediately above the water. As this moist, marine air cools, water vapor condenses into water droplets, and low clouds form. These lumpy, sheet-like clouds are called marine stratocumulus, the most common cloud type in the world by area. Stratocumulus clouds typically cover about one fifth of Earth’s surface.
In some of the less cloudy parts of the world, the influence of other physical processes are visible. For instance, the shape of the landscape can influence where clouds form. Mountain ranges force air currents upward, so rains tend to form on the windward (wind-facing) slopes of the mountain ranges. By the time the air has moved over the top of a range, there is little moisture left. This produces deserts on the lee side of mountains. Examples of deserts caused by rain shadows that are visible in the map above are the Tibetan Plateau (north of the Himalayan Mountains) and Death Valley (east of the Sierra Nevada Range in California). A rain shadow caused by the Andes Mountains contributes to the dryness of the coastal Atacama Desert in South America as well, but several other factors relating to ocean currents and circulation patterns are important.
Note because the map is simply an average of all of the available cloud observations from Aqua, it does not illustrate daily or seasonal variations in the distribution of clouds. Nor does the map offer insight into the altitude of clouds or the presence or absence of multiple layers of clouds (though such datasets are available from MODIS and other NASA sensors). Instead it simply offers a top-down view that shows where MODIS sees clouds versus clear sky.
Since the reflectivity of the underlying surface can affect how sensitive the MODIS is to clouds, slightly different techniques are used to detect clouds over the ocean, coasts, deserts, and vegetated land surfaces. This can affect cloud detection accuracy in different environments. For instance, the MODIS is better at detecting clouds over the dark surfaces of oceans and forests, than the bright surfaces of ice. Likewise thin cirrus clouds are more difficult for the sensor to detect than optically thick cumulus clouds.
THE VERTICAL DISTRIBUTION OF CLOUD
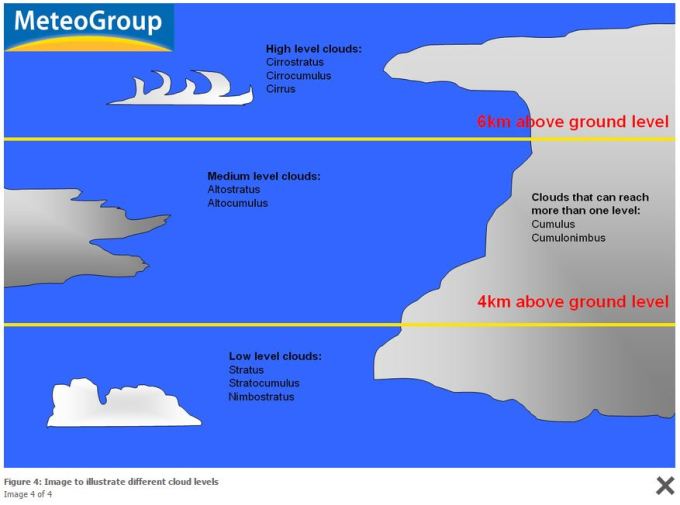 About half of the atmosphere is below 5 km in elevation and half above. Cloud is present in both the upper and the lower half of the atmospheric column. In near equatorial latitudes very high cloud extends into the stratosphere. The jet streams at 8-15 km in elevation were first identified by tracking the movement of cirrus clouds.
REALITY CHECK: A QUESTION OF SCALE
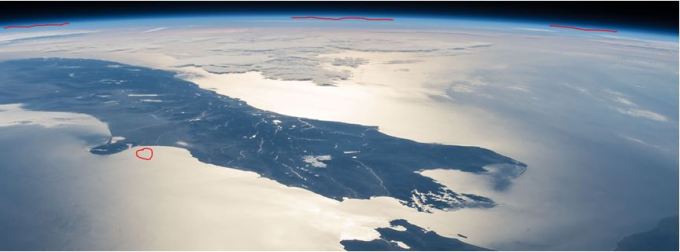
The photo above was taken from the International space station at an altitude of 431 kilometres above the surface of the Earth. A red circle is marked in the sea off Christchurch, New Zealand.
Gravity holds the Earth’s atmosphere in a close embrace. Really close. As seen in the photo the atmosphere refracts blue light like a prism on the margins of the globe. The red line at the margin, in its thickness, represents a depth of about 27 km. Some 98% of the atmosphere lies within 27 km of the surface of the planet.
Project Loon, a venture by Google, employs balloons that travel at an elevation of 20 km finding sufficient variation in the winds to enable these balloons to circumnavigate the globe in 10 days and land at preordained locations.
In 1920 Gordon Dobson registered his interest in the winds of the stratosphere using theodolites to track sounding balloons. Strong winds in the stratosphere led Dobson to the measurement of ozone as the source of density variations that could explain these winds.
The stratosphere is a vigorous medium. The tongue of mesospheric air inside the polar vortex penetrates to the 250 hPa pressure level at 8 km of elevation and tracers of mesospheric air from both the mesosphere and the near surface atmosphere can be observed mixed with ozone throughout the stratosphere. NOx is a potent source of ozone depletion changing surface climate because of its effect on ozone and surface pressure.
In 1956 when a Dobson spectrometer was utilized to measure total column ozone for the first time at the British Antarctic base at Halley Bay, the Antarctic ‘ozone hole’ was discovered, amazing Dobson who was familiar with the pattern of ozone variation in the Arctic and therefore completely outside his field of experience. This ‘hole’ was later seized upon by environmentalists as an instance of man’s capacity to abuse the planet.In truth, the 1956 observation indicates that the ozone hole existed prior to the widespread use of refrigerants and is a product of the atmospheric circulation in high latitudes. The ozone hole narrative, a pillar of today’s climate science’ stands in the way of a true appreciation of atmospheric processes.
REALITY CHECK: ATMOSPHERIC HEATING DUE TO THE PRESENCE OF OZONE ORDERS THE GENERAL CIRCULATION OF THE WINDS
The atmosphere is heated by contact with warm surfaces, secondly at cloud level by the release of the latent heat of condensation (notably tropical cyclones) and thirdly in the as ozone absorbs radiation from the Earth itself. Low pressure systems at latitudes between 30° and 70° of latitude have their origin in ozone heating. These low pressure cells set up a rising circulation that engages the totality of the atmospheric column. In mid to high latitudes ozone is the primary driver of lapse rates. In high latitudes ozone is ubiquitous throughout the atmospheric column. Low pressure systems (cold core polar cyclones) form over the oceans. In the northern hemisphere winter the Pacific sector in overwhelmingly dominant. Once initiated in the stratosphere, a low pressure system lifts ozone into the ascending circulation accounting for the relatively static location for elevated total column ozone and markedly lower surface pressure over the north Pacific in late autumn/ winter. In the southern hemisphere polar cyclones surround the Antarctic continent with a tendency to be most intense south of New Zealand.
A high pressure system in the mid latitudes can span 3,000 kilometres in its horizontal extent and manifestly involves the circulation of the air in both the troposphere and the stratosphere. As surface pressure increases so does geopotential height, indicating ozone heating. In chapter 3 we noted that the surface warms as geopotential height increases as a simple result of the expansion of the ‘clear sky window’.
At the equator convective clouds push wet air upwards to 15 km in elevation and moist air rich in tropospheric NOx invades the stratosphere, the prime reason for the relatively low levels of total column ozone in low latitudes.It is for this reason that high pressure cells are much denser aloft than low pressure cells, compensating for the warmth and lack of density near the surface to the point that surface atmospheric pressure is enhanced.
The novelty of this view of the atmosphere resides in the recognition of ozone as the source of surface pressure variation. It is in the mid to high latitudes of the winter hemisphere that surface pressure varies most aggressively. Secondly the novelty resides in the view of the stratosphere as a vigorous deterministic medium. Thirdly, it is novel in the notion that the entire atmospheric column moves ‘wholus bolus’ with scant regard to conceptual notions relating to a vigorous ‘troposphere’ and a static, quiescent stratosphere.
As Gordon Dobson observed back in the thirties , total column ozone maps surface pressure, the ozone content of the upper air determining the character of the winds at the surface. In fact, this view of the atmosphere is not so new. It was prevalent in the 1950’s when RM Goody, a colleague of Dobsons at Cambridge wrote:’The idea is gaining ground that, from the dynamical standpoint, the stratosphere and the troposphere should be treated as a single entity’. RM Goody, The Physics of the Stratosphere 1954. p. 125.
Our imaginations baulk at the idea that the atmosphere is thin and vertically interactive. The mental constructs that we have been taught, involving a supposedly quiescent stratosphere, lead us astray, especially when it comes to appreciating atmospheric dynamics in high latitudes. High latitudes are so cold that few of us venture there. A very few hardy souls actually reside there. One thinks of the monkeys who take advantage of hydrothermal energy in northern Japan, the hardy Eskimos of North America and the wildlife that visits Antarctica for the ‘season’.
Palpably, change in what we refer to as ‘the stratosphere’ is the source of variations in surface pressure on daily, weekly, decadal and centennial time scales. The stratosphere has a geography that is as fascinating as that at the surface of the planet, in fact, given its importance in determining daily weather it should be more so. The search for the origins of natural climate variation takes us inevitably to the stratosphere. In order to appreciate the power in the processes involved we need to maintain a sense of scale. This helps us to understand the coming and going of cloud, the most important determinant of surface temperature.
NATURAL CYCLES IN CLOUD AND ALBEDO
In the main cloud is made up of highly reflective crystals of ice because within a couple of kilometres of the surface, in temperature latitudes, temperature is at freezing point. Less cloud forms over land. The mid latitude high pressure cells are relatively cloud free. These clear sky windows expand and contract on a seasonal basis being more expansive in the winter hemisphere driven by heating in the summer hemisphere and a seasonal movement in atmospheric mass from the high latitudes of the winter hemisphere. It is the accumulation of ozone in the winter hemisphere that drives inter-annual climate variations. It is the ozone narrative of the environmental movement that stands in the way of an appreciation of the source of natural climate variation.
ATMOSPHERIC HISTORY
The phenomenon of mass transfer associated with ozone heating in high latitudes in winter has long been described as the Arctic or the Antarctic Oscillation, or on a regional scale as the North Atlantic Oscillation. Only recently has it come to be called the ‘Annular (ring like) Modes of inter-annual and inter-decadal climate variation’ that affects both hemispheres primarily in winter.
There is a very long period of variation in the Antarctic Oscillation that is undocumented. It is inter-centennial in its time scale and we don’t have the data to represent it. As of 2015 reliable data for the atmosphere goes back just 70 years. Of that period the first thirty one years has been documented by a process of interpolation based on sketchy data from the pre-satellite age and this especially applies to the southern hemisphere.
We have excellent well standardised data from 1979 from a few well maintained and closely scrutinised instruments that travel around the globe on a twice daily schedule, an immense improvement on the past where many instruments, poorly standardised, poorly located, subject to re-siting and the vagaries of interpretation by multitudes of observers, but during working hours only, who could nevertheless cover just a fraction of the whole with spot rather than continuous observations. Observations were recorded on fragile pieces of paper. Data from the pre satellite age is ……well, despite all the effort, very hard to locate, full of gaps, in the case of temperature much affected by the choice of housing for the instrument and change in the local built and natural environment, therefore of questionable utility and much subject to ‘reinterpretation’. But, there is one parameter in the climate record, atmospheric pressure, that is entirely unaffected by the choice of location for the instrument. The instrument we call a ‘barometer’ that works as well on a rolling ship as on land, in the sun or in the shade. There is therefore no reason for re-interpretation of the surface pressure record.
Here is the kicker: The surface pressure record indicates that it is in high southern latitudes that surface pressure varies most widely. It also indicates that there has been a loss of atmospheric pressure over Antarctica of about 15 hPa over the last 70 years.
Those who are employed to predict the weather diligently map surface pressure variations and they see the origin of surface pressure variation here: http://www.cpc.ncep.noaa.gov/products/stratosphere/strat_a_f/
Their focus is on the stratosphere.
VEGETATION AS WATER PUMP : THE CLOUD ENHANCER OVER LAND
Observe the dense cloud cover over the Congo in the second photo above,and to a lesser extent over East Africa by contrast with cloud cover over the Sahara and the Kalahari Desert in Southern Africa and the very cold waters coursing northwards from Cape Town.
It takes particular circumstances to produce cloud over land in summer . What is required is a cover of actively transpiring vegetation that launches water vapour into the atmosphere. Nowhere is this more obvious than the zones that support tropical rain forest. As a general rule, if we desire cooler surface temperatures and more precipitation we should plant trees and avoid clearing high density vegetation unless it is to be replaced by a higher density of vegetation. It is commonly observed in the more arid portions of Australia that cloud forms over native vegetation rather than land cleared for pasture or grain growing.
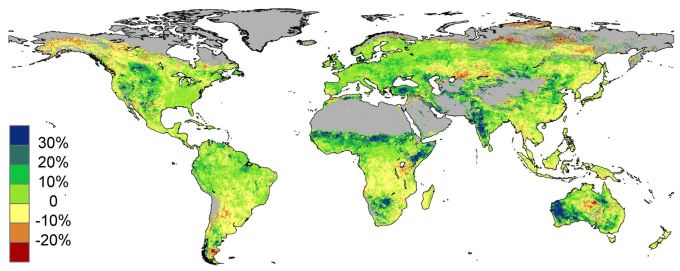
From a plants point of view carbon dioxide is a scarce resource that is available at near starvation levels. When more carbon dioxide is available plants that are at the dry end of the spectrum in terms of available water respond magnificently. Australian CSIRO scientist Randall Donohue published the image below that documents the re-vegetation response to carbon dioxide . Apparently, the drier the environment the better the foliage gain from increases in CO2. This gain documented in the map has accrued between 1982 and 2010. Source: http://www.csiro.au/en/News/News-releases/2013/Deserts-greening-from-rising-CO2
Urbanization has contributed to the warming of the planet as societies have cleared natural vegetation, industrialized, laid down roads to facilitate the movement of people and goods on a massive scale, provided lighting at night, expanded the suburbs on the margins of cities and built glass covered multi story buildings that trap heat and require air conditioning. Man has harnessed the power of fossil fuels, falling water, the sun and the wind to drive engines to perform work and to cool and warm the structures he creates. All this results in localized heating but the area involved is tiny. Look for the night lights as you travel by air and observe their sparsity. Trust to enhanced convection to deal with the temperature increase. Remember that much of the Earth is undesirably cool from the point of view of plant productivity.
All life depends upon the productivity of plants and much of the earth is arid. It is in these areas that enhanced availability of carbon dioxide gives the greatest response. Remember that there is nothing like native vegetation for producing clouds and cooling the surface. With the enhancement of carbon dioxide in the atmosphere the earth is entering a golden age of enhanced plant productivity.
Along with enhanced leaf area in dry areas we get greater evaporation, greater cloud cover and enhanced rainfall.Irrigation of dry areas enhances this process actively changing the climate for the better.
CLOUD OVER THE SEA: ENERGY GOING INTO THE BATTERY.
The two maps below reflect the distribution of cloud and surface atmospheric pressure. Large areas over the oceans experience high surface pressure, sparse cloud cover, low precipitation and relatively high evaporation. Except for a band of high precipitation extending south easterly from New Guinea almost the entire zone between the equator and 30° south is ‘clear sky window’. The sea traps energy by virtue of its transparency to as much as 300 metres in depth. It yields that energy slowly, transferring it to colder regions. Operationally, if one were to increase the areas that are coloured brown you increase the energy cycling within the ocean and this raises the surface temperature of the globe. The flux in the cloud free areas involved is driven by the annular modes phenomenon, a response to ozone in the stratosphere.
Observe the symmetry in the two maps below. The distribution of evaporation less precipitation maps surface pressure and the distribution of cloud.
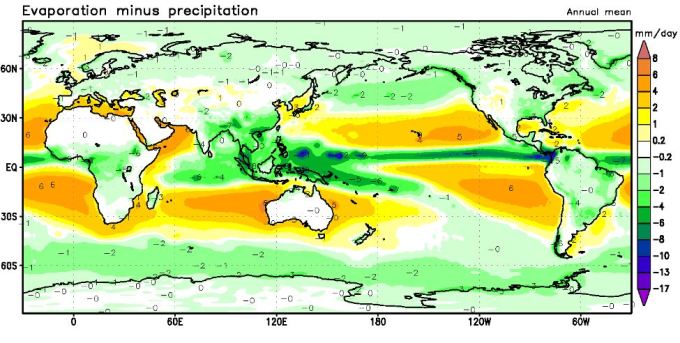 Source: http://ds.data.jma.go.jp/gmd/jra/jra25_atlas/eng/indexe_surface13.htm
SEASONAL WARMING OF THE GLOBE
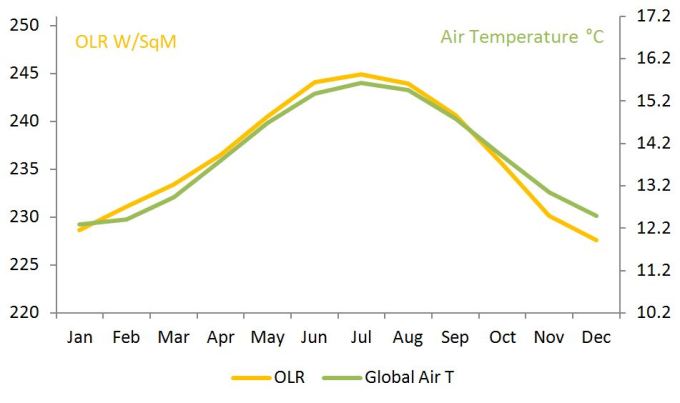
Consider the annual average of global air temperature as against top of atmosphere global outgoing radiation as documented on the left and right axis of the figure immediately below. The placement of the curves in the vertical dimension is arbitrary.I bring them into close association only to assess variation in their evolution according to the time of the year.
A system that is neither heating or cooling needs to be in balance across the year. From September through to January outgoing long wave radiation lags the temperature curve indicating energy entering the system in excess of that leaving. This seasonal increase in energy acquisition relates to the annular mode phenomenon. It is at this time of the year that the southern and the northern annular modes most drive change in the distribution of atmospheric mass opening up the ‘clear sky window’. In effect the ocean absorbs energy without immediately re-transmitting it.
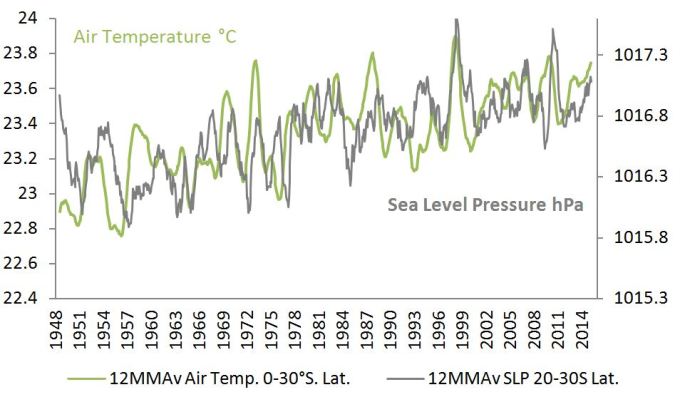
In a system where surface temperature is static then outgoing long wave measured at the top of the atmosphere should also be static. Below is the data for both air temperature in the 0-30° latitude band (where the clear sky window is most extensive) and whole of Earth outgoing long wave radiation. Since 1998 both are essentially static despite the steep increase prior to that date. In the short term air temperature in the near tropical ocean is a function of the changing volumes of cold water introduced into the tropics due to flux in the planetary winds but in the long term these two series must vary together.
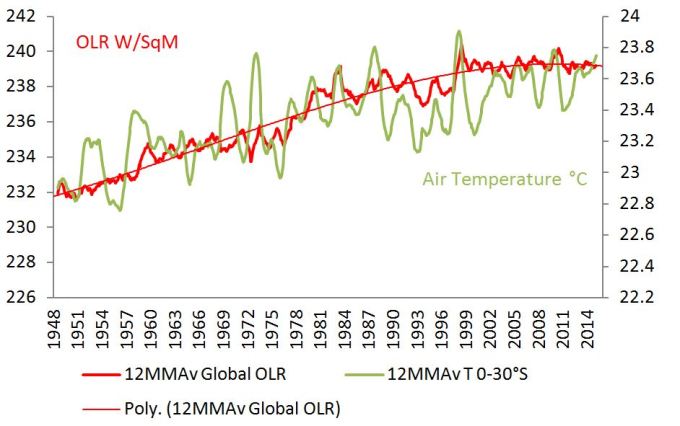
The stabilization of long wave radiation after 1998 at about 230 watts per square metre indicates a system that is no longer gaining energy. This, despite the vagaries of change in surface temperature, is the plain reality.
In the relatively cloud free zone between the equator and 30° of latitude we would expect temperature to increase as surface pressure increases due to an expansion of the ‘clear sky window’. The diagram below indicates a relationship but it is plainly not direct, at least in the short term and we see that the increase in temperature frequently precedes the increase in surface pressure.Why is this so? There are several reasons:
- Ocean currents driven by the planetary winds bring cold water from higher latitudes into the tropics displacing warmer water, the primary mode of short term variation in the temperature of the waters in the tropics.This acts to cool the tropics as surface pressure increases in mid latitudes opening the clear sky window that warms the extra tropical waters.
- A strong warming dynamic in the South Eastern Pacific about the continent of South America precedes the temperature increase in the tropics by as much as a year. The flux in surface pressure across the Pacific is much stronger than across other oceans or indeed the global tropics taken as a whole.
- The Arctic Oscillation Index is currently in decline indicating an increase in surface pressure in the Arctic, a loss of surface pressure in the mid latitudes and a falling away of the strength of the winds that drive the circulation of the waters in the northern hemisphere. So, since 1998, El Nino bears the stamp of Arctic processes in the way that it manifests.
SOME OBSERVATIONS IN RELATION TO THE MANNER IN WHICH THE TEMPERATURE OF THE GLOBE CHANGES NATURALLY
- Earth is a very watery, very cloudy planet much subject to temperature swings according to the extent and density of cloud cover.
- Over land, 30 percent of skies are completely cloud free but the land is incapable of transferring energy to depth or retaining it and transfers that energy to the atmosphere, mostly within the 24 hour cycle, in the process reducing cloud cover in the middle of the day and allowing it to increase in the late afternoon. The annual cycle in global temperature involves a maximum in northern summer as the enormous land masses of the northern hemisphere heat the atmosphere and cloud falls away. Solar radiation is 6% less intense in northern summer due to orbital considerations. However a falling away of cloud cover at this time of the year allows more energy to reach the surface producing a temperature maximum for the globe as a whole in mid year.
- The oceans are transparent to solar radiation and consequently store energy. Over the oceans, less than 10 percent of the sky is completely clear of clouds at any one time. This limits the uptake of energy by the oceans delaying and transferring the surface temperature response to a reduction in cloud cover. In clear waters light penetrates to a depth of 300 metres.
- Two thirds of the global oceans are in the southern hemisphere.
- Globally, cloud cover is greatest in southern summer when the Earth is closest to the sun and solar radiation is 6% stronger due to orbital considerations. This is when the globe as a whole is coolest and most susceptible to warming via loss of cloud cover. The evidence is that between September and January, the Earth emits less energy than it receives. At this time polar processes drive change in atmospheric ozone levels from year to year and across the decades.
- The expansion and contraction of the Hadley cell in the southern hemisphere affects the distribution and extent of cloud across the southern hemisphere. On an inter-decadal scale an expansion of the Hadley cell as surface pressure rises in the mid latitudes exposes more of the southern oceans to solar radiation. This is palpably the most important dynamic driving global surface temperature in the long term. Neither this nor the impact of ozone in driving shifts in atmospheric mass that lies behind the expansion of the Hadley cell are recognized in the works of the UNIPCC.
- The Southern and the Northern Annular Modes govern the extent of the relatively cloud free high pressure cells that form over the ocean The NAM is influential in determining the swings in surface temperature between 30° south latitude and the northern pole with regular repeating variations that reach a maximum in January and February. The SAM cycles on an inter-centennial time scale providing the long swings upon which the NAM creates the surface chop.It produces the largest temperature swings that are seen in June and July south of 30° south. Although apparently lacking potency by comparison with the NAM on a centennial scale the SAM is much more variable than the NAM and drives the whole.
- The origin and cause of the NAM and the SAM is unknown to climate science because the role of ozone in giving rise to polar cyclones that determine the flux in surface pressure in high southern latitudes is as yet unrecognised. The most important source of convection, the jet streams and the flux in the weather on all time scales is still a mystery to climate science even though the importance of the stratosphere in determining the flux in surface pressure was realised a hundred years ago. The source of the natural variability that vacillates on centennial time scales is not a question that exercises the minds of climate scientists. Climate science of the IPCC variety appears to be blissfully unaware of the marked loss of mass in high southern latitudes over the period of record.
- In Southern summer the concentration of ozone in the global stratosphere is controlled by Arctic stratospheric processes. This is expressed as a dynamic fluctuation in surface temperature in the 0-30°south latitude band, and across the entire northern hemisphere, in the months of January and February. This is the signature written in the temperature record that identifies the source of surface temperature change.
- Surface temperature anomalies are associated with anomalous increases in geopotential height that manifest from the surface through to the stratosphere. This surface temperature increase is related to cloud cover variation due to ozone heating. We know this is the case because the temperature of the upper air varies more strongly than the air at the surface. It is not possible for change at the surface to produce an amplified change at elevation. Dissipation rather than gain is the rule.
- As a surface dweller humans are well aware that temperature varies according to the origin of the air that meets us when we step outdoors in the morning. Change in the planetary winds changes the origin of surface winds and is conjunction with change in surface pressure, geopotential height and upper atmosphere ozone. The chain of causation is top down. Climate science as presently promulgated is unaware of this dynamic. It is in a sad state of constipation due to an ideological insistence that change must be bottom up in origin. Climate science is unaware of the basic dynamic governing the planetary winds and surface temperature.
- Recognition of ozone as the driver of the annular modes via the marked increase in ozone partial pressure outside the margins of the tongue of mesospheric air that descends from the stratosphere would interfere with the favoured ozone hole narrative of environmentalists. The Montreal Protocol for the phasing out of certain chemicals used as propellants and refrigerants, a high water mark for the environmental movement would then be seen as resulting from a mistake in the interpretation of atmospheric processes. There is too much at stake for the environmental movement to revise its opinion on this matter.
- Given the active circulation in the global oceans the temperature of tropical waters is probably a reasonable indicator of the amount of energy stored in the system, at least on decadal scales that average for the flux in the planetary winds and the resulting ENSO phenomenon. The rate of inflow of cold waters into the tropics via the currents that flow equator-wards along the western margins of the continents is highly variable. It is driven by the planetary winds that vary in velocity with changes in surface pressure. It is commonly observed that tropical waters cool as the trade winds strengthen. Increased velocity in the trade winds and the westerlies is due to the transfer or atmospheric mass from high to mid latitudes as ozone levels increase at the pole driving enhanced vorticity in cyclones of ascending air and the jet stream aloft. This is in turn associated with increased geopotential heights in the mid latitudes reduced cloud cover and surface warming. So, we have a conjunction of mid latitude warming due to reduced cloud cover and cooling in the tropics as increased wind velocity drives more cold water into the tropical circulation displacing warm waters into higher latitudes to raise surface temperature in those higher latitudes as it falls in equatorial latitudes. The action that really matters, in terms of energy acquisition, happens outside the narrow latitudes where ENSO is measured and in the southern hemisphere in particular.For most observers this is mind boggling.Those who look for the origin of the El Nino phenomenon are looking in the wrong place if they confine their attention to the narrow latitude bands where surface temperature varies most strongly.
- By virtue of the area involved, the tropics as a whole makes a large but somewhat misleading contribution to the global temperature statistic. The flux in temperature in the tropics is large in amplitude but it is driven according to a longer time schedule, years rather than months in accord with change in the planetary winds. The flux in temperature in the mid to high latitudes is vigorous, particularly so in the northern hemisphere and peaks with monotonous regularity in particular months of the year under the influence of polar atmospheric processes.
- Change in sea surface temperature on inter-decadal time scales is signalled in the months of January and February and July through to October under the influence of the Arctic and the Antarctic respectively. The change in surface temperature in other months is muted by comparison and in some instances opposite in sign to that in the months that show peak variation. There is no apparent groundswell of temperature increase across all months in accord with the increase in the atmospheres burden of well mixed long wave absorbers that would indicate a greenhouse effect at work.
- Taken together, these observations support the contention that cloud cover is the prime source of variation in the amount of solar energy stored in the earth system.
- The atmospheric column over Antarctica is the source of climate variation globally. Change in geopotential height over Antarctica precedes change elsewhere frequently imposing mirror image responses in the Arctic.
- Extremes in weather in the tropics, such as tropical cyclones and cyclones of polar origin are driven by entirely different modes of causation, the former by warm seas, moist air and precipitation the latter by change in the ozone content of the air aloft. We do not have to have recourse the grab bag called ‘climate change’ that implies anthropogenic modes of causation to explain extremes in climate and weather. We should be more discerning, more observational and more logical, in our thought processes. Currently those who pretend to have all the answers are behaving like primitives.

Some reaally well presented points in this chapter Earl. Point 12. Could do with more clarification for me though. It appears you are saying man-made ozone killing emissions should not have been curbed? Does it matter what the intent was or whst the actual effdct is.? Surely we need to consider the real effect, not the intent. Otherwise its the same argument as IPCC pursuing CO2 as the culprit. …. Sorry it appears that I am the only one commenting on your blog, but its only because it makes more sense to me than many others, and the topic goften gets derailed. All the best. Macha
LikeLike
Hi Macca, your comment is always welcome. You are my only regular. But, I am working on it. Do you follow: https://notalotofpeopleknowthat.wordpress.com from the UK where people have much better manners than those who frequent Watts Up with That. Very active, very strong content.
Back to your point re 12.: The Montreal Protocol was a mistake. Factors other than the anthropogenic emission of refrigerants are overwhelmingly more important in determining the ozone content of the air over the polar cap. The troposphere is rich in Nox, oxides of nitrogen that, when uplifted into the stratosphere over the equator destroy ozone in part accounting for prevailingly low levels of ozone in the atmosphere at low latitudes. You can see this happening at 100hPa here: http://macc.aeronomie.be/4_NRT_products/5_Browse_plots/1_Snapshot_maps/index.php?src=MACC_o-suite&l=TC
Refrigeration in households gathered strength in the US from the thirties but were not in common use in Australian households till the sixties. Dobson’s instrument was used to measure total column ozone in Antarctica for the first time in 1956 and to his great surprise there was a ‘hole’ that, given his knowledge of the Arctic going back twenty years or so, was so much of a surprise that he diagnosed an instrumental error. Next year, in spring, at Halley Bay, the British base, they tried again. It was not an error. Here was an ‘ozone hole’.
I am looking closely at this phenomenon and so far as I can see, since it manifests more in the lower than the upper stratosphere, and manifests at a time when total column ozone peaks outside the vortex, its likely due to entrainment of NOX rich air from the lower atmosphere in the zone of intense uplift that is unusually strong in spring just prior to the point at which the stratosphere warms to its elevated summer temperature. In summer, the vortex contracts and ozone rich air invades the atmospheric column above Antarctica causing generalized uplift and a reversal of the winds aloft. At 10hPa zones of uplift rotate in the opposite direction to zones of downdraft.
The ozone content and the temperature of the stratosphere are to do with which particular type of air is occupying the cubby house. In winter, its air from the mesosphere, cold, dense and ozone deficient. In summer its warm, low density ozone rich air that is temporarily displaced by the mesospheric air in winter as surface pressure builds…in the case of Antarctica, to a planetary maximum.
The ozone rich air on the margins of Antarctica produces a planetary minimum in surface temperature all year round. The lowest surface pressures occur at the time of the year the ozone hole manifests. Hence intense uplift.
LikeLike
Dislexic moment: The ozone rich air on the margins of Antarctica produces a planetary minimum in surface PRESSURE all year round.
LikeLike
Music to my ears, but I think it will be slow work getting your point on ozone to sink in with the cabal at the climate alarmist control central.
LikeLike
Rob R. The climate control claque, would, if they were to examine the argument see it as treason of the worst sort. It will not disturb them however because they don’t look and they are not curious. If they were at all curious they would have abandoned their current modes of thought a long time ago. They are quite safe. Observation and deduction are foreign to them. They will remain oblivious and so perfectly free to pursue their agenda with the usual fervour.
There have always been and will always be groups who behave like this. The real worry is that society/the intelligentsia/the ruling classes have allowed this to happen.
LikeLike
Erl I am sure your Blog has a good following but many like myself have nothing much to add to your interesting work. I keep a watchful eye out for each installment
LikeLike
Gibo,
Thanks for the contact. I would like the blog to have a much bigger following. Perhaps by the time the argument is fully developed it will. I am about half way through the exposition. Easy way to keep in touch is to subscribe. That way an email comes to announce the new chapter.
If there is anything that doesn’t make good sense to you please tell me.
LikeLike
Hi Earl, yes I do follow Paul homewoods site. Have done for ages, along with several others. I do agree wuwt has attracted some very crude commentary in recent times. I guess its a balance between moderating and sensorship. Keep at it i say, there is no failure in science, just a new pathway to follow.
LikeLike